The Top 5 Banks of Chile

The top five banks of Chile based on assets held at the end of 2009 are noted below in descending order:

1. Banco Santander Chile (SAN)
Current Dividend Yield: 2.91%

2. Banco de Chile (BCH)
Current Dividend Yield: 4.53%

3. BCI
BCI does not trade on the U.S. markets.

4. BBVA – Chile
BBVA-Chile does not trade on the U.S. markets.

5. CorpBanca (BCA)
Current Dividend Yield: 3.93%

Note: Dividend yield is as of Dec 10, 2010

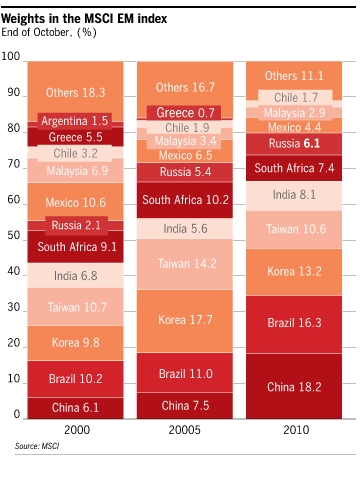
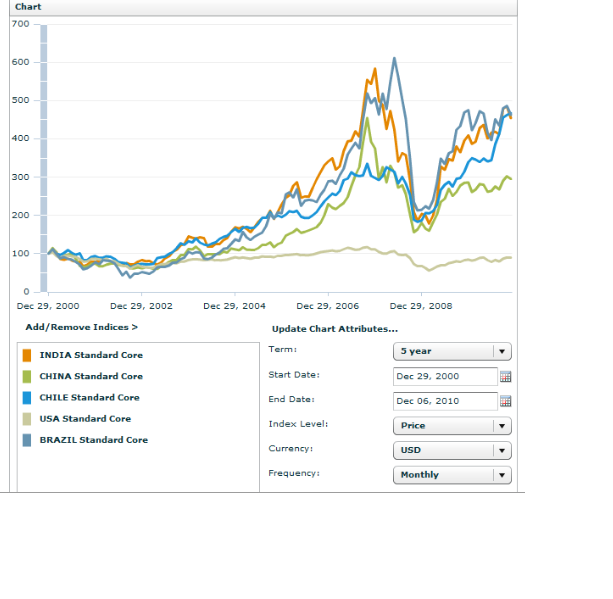
Chile has been one of the best performing markets this year primarily due to rising commodity prices especially copper and also fluctuations of the peso against the dollar. As of December 9, 2010 Chile is up over 35.0% compared to about 10% for the S&P 500.

Among the three Chilean bank ADRs listed above, CorpBanca has been the best performer in terms of returns over the last five years. A $10K in BCA 5 years ago would have been worth about $42,000 with dividends reinvested as of this month. All the three banks have had strong runs this year and are now trading near their 52-week highs. Hence from an investment standpoint it is better to wait for some pullbacks and add new positions in small increments.

Disclosure: Long BCH

Composition of the MSCI Emerging Markets Index

The chart below shows the weightings of different emerging markets in the MSCI Emerging Markets Index in 2000, 2005 and 2010 (as of the end of October):

MSCI-EM-Index

Source: FT BeyondBRICs blog

Mexico and Taiwan had the most weightage in the index a decade ago. Now China represents the largest weightage followed by Brazil. China and Brazil have seen their representations increase dramatically since 2000. Despite the strong growth experienced by India in the last 10 years, India’s weighting in the index has moved very little.

Today the emerging markets of China, Brazil, Taiwan and South Korea account for 58.3% of this index. So one of the disadvantages of this index is that it is heavily concentrated on just four countries.

Two ETFs that track the MSCI Emerging Markets Index are:

Vanguard Emerging Markets Stock ETF (VWO)
iShares MSCI Emerging Markets Index Fund (EEM)

Financials and materials are the largest two sectors in these ETFs. In 2009, government stimulus in emerging countries helped these sectors grow tremendously. The MSCI EM index rose by about 75%  last year after falling more than 50% in 2008. So far VWO and EEM are up by about 15% this year.

Disclosure: No positions

Invest in China via the US

The Shanghai Composite Index is down 14.2% YTD compared to a rise of 10.6% for the S&P 500. Chinese stocks have lagged their emerging peers such as India, Brazil, etc. as well this year as investors avoid investments in the country due to fears of a massive bubble. However many Chinese IPOs continue to be listed on the US markets making China of the hot markets for investment banks. While some of the IPOs have performed well many have not met expectations of success. Yesterday Chinese movie distributor Bone Film (BONA) opened flat at the IPO price of $8.50 and then lost 22.4% to close the day at $6.60. According to Dealogic this decline was the worst this year.

Despite most investors’ worries about China, one US fund manager likes Chinese stocks. From a report in UK-based Trustnet:

Investors and managers are at risk of missing investment opportunities as they get distracted by the “noise” of economic data, according to RENN Universal Growth Investment Trust’s manager Russell Cleveland.

“There is a lot of noise around Ireland, Greece, and China, and that can mean you miss the melody of what’s really happening,” he said.

He added: “Economic policy from the US, worries on the Eurozone and fears on a China bubble dominate the news, but often these factors have very little impact on my portfolio.”

The Dallas-based manager invests in small, innovative Chinese companies which are listed in the US. He prefers companies which are led by their founders, and who have a significant holding in their own business.

“There are more than 300 China-based companies which are traded in the US, so it’s a good universe we’ve got to pick from. Accessing China through the US is a more stable way to get exposure to the growth in the emerging markets country,” he said.

Speaking on the possibility of a bubble in China, Cleveland says property might be cyclical, but it won’t necessarily mean anything to investors.

“There are too many apartments in China, that much is true, and real estate will be a cyclical sector, but not the whole country. China is very strong financially. The rate of growth might slow, but that’s not a bad thing,” he said.

One way to identify some of the promising Chinese companies is to use the recently-launched BNY Mellon China ‘Xia Yi Dai’ or the “Next Generation” ADR Index. This index is comprised of the “Next Generation” of Chinese growth companies from sought after industries, including Internet, alternative energy and media.

Some of the features of this index are:

  • Companies’ primary listing is to be in the form of Depositary Receipts (DRs) traded on a U.S. exchange.
  • Constituents are subject to both liquidity screens and a minimum free-float market capitalization of at least $100 million.
  •  The index is modified capitalization-weighted and adjusted for free-float.

The 30 constituents of the BNY Mellon China ‘Xia Yi Dai’ Index are listed below with their DR tickers:

[TABLE=855]

Duoyuan Global Water (DGW) and VisionChina Media (VISN) are down about 65% YTD.
Hotel-chain operator 7 Days Group (SVN) is up about 92% YTD. Companies such as China Real Estate Information (CRIC) can be avoided as it is a real estate play.

Disclosure: No positions

Comparison of Healthcare Expenditure Across OECD Countries

Healthcare spending is about 9% of GDP on average in OECD countries. However in many countries it exceeds 10% of the GDP.

Over three quarters of healthcare spending is publicly funded. The current economic crisis, ageing populations, rising budget deficits, soaring healthcare costs and other factors are forcing healthcare spending to be tightened in most developed nations.

The chart below shows healthcare expenditure across OECD countries:

US-OECD-healthcare-spending

Source: OECD Observer

Among OECD countries, the US has the most in private expenditure when compared to public expenditure on healthcare. Despite the huge government budgets for medicare, medicaid and other programs, Americans spend more out of their own pockets on healthcare than citizens of other developed countries.With increasing healthcare premiums and costs, this figure will go higher in the future.

MSCI Index 10-Year Performance: U.S. vs. Select Developed, Emerging Markets

In a post titled “The Magic of Buy & Hold vs Trend” fellow blogger Barry Ritholtz noted the following interesting fact yesterday:

“On December 31, 1998, the last trading day of the year, the SPX closed at 1229.23. That is within 10 points (not 10 percent, but 10 points!) of where it is today.

Over the course of these dozen years, we have seen a 68% rally (to the 2000 top), a 50% sell off (March ’03 lows), a 104% rally (October ’07 top), a 58% drop (March ’09), and an 83% move up (April 2010 highs).”

I wanted to check how U.S. stocks performed relative to foreign developed and emerging markets in the last 10 years. So I reviewed the performance of the MSCI indices of the respective countries.

1. MSCI Index Performance – U.S. vs. Select Developed Markets:

Click to enlarge

us-dev-mkts.png

In the above chart, US stocks performed the worst in the past 10 years. Canadian stocks performed better easily beating US, France, Spain, Germany and UK. Despite the recent fall in European markets, European stocks are well ahead of US stocks in terms of returns.Spanish stocks are also better performers compared to US stocks in spite of the recent debt crisis there. This chart shows how US investors can amplify their returns by investing in foreign stocks. Even investing in companies north of the border yields higher returns.

2.  MSCI Index Performance – U.S. vs. Mexico, Canada:

us-mex-can.png

While Canada performed better than US in the last 10 years, Mexican stocks yielded even higher returns as shown in the chart above.

3. MSCI Index Performance – U.S. vs. Select Emerging Markets:

us-emerging-mkts.png

Source: MSCI Barra

This chart shows that the U.S. has lagged emerging markets such as Brazil, India, China and Chile in the past decade. US stocks (shown in grey line) have practically gone nowhere in this time period whereas emerging stocks have yielded incredible return to investors. Based on the returns of MSCI indices, Chile and Brazil have been better performers than China and India.

The above three charts clearly show that investors seeking higher returns have to look beyond the shores of the U.S. Hence instead of merely sticking to U.S. companies as in the past investors may want to expand their horizon and explore some of the high quality stocks elsewhere in the world.

Related ETFs:
Vanguard Emerging Markets ETF (VWO)
iShares MSCI Emerging Markets Index ETF (EEM)
iShares S&P 500 Index Fund (IVV)
iShares MSCI Canada ETF (EWC)
iShares MSCI UK ETF (EWU)
iShares MSCI Spain ETF (EWP)
iShares MSCI Germany ETF (EWG)
iShares MSCI Chile ETF (ECH)
iShares MSCI Brazil ETF (EWZ)

Disclosure: No positions