Relationship Between the Price of Gold and CPI

Gold prices surged 1.8% to close at $1,340.70 an ounce yesterday as investors sought the safety of the yellow metal. Despite the slight fall in gold prices so far this year, gold has had an incredible run in recent years.

An article in The Wall Street Journal takes a bearish view on gold suggesting that gold’s golden era may be over.
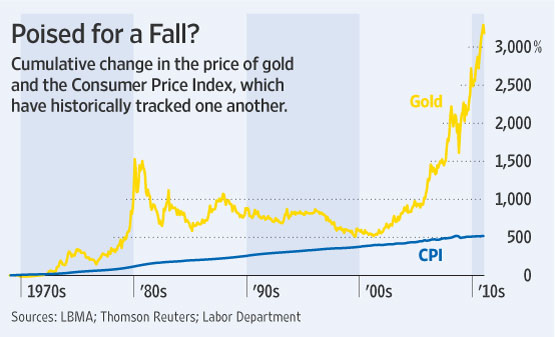
gold-cpi.jpg

 From the article:

How far could gold fall in the short term? Technical measures suggest that gold’s current price is close to its near-term “support” level—the price at which investors, attracted by a perceived bargain, are expected to rush in. If it falls below $1,320 and stays there, the next price where buyers would be expected to cluster would be near $1,280.

Over the longer term, too, the case for gold seems less compelling, say some analysts. While the metal has traditionally been seen as a buffer against runaway inflation and a collapsing dollar, at these prices gold may have less value as an insurance policy than investors might think.

Take inflation. From 1968—when investors started to price in the possibility of the U.S. dropping the gold standard—to 2001, the price of gold rose 5.6% a year, while the Consumer Price Index gained 5.1% annually. That hasn’t been the case recently: Since 2001 gold has surged 18.8% annually, while the CPI has risen just 2.3%.

To restore their historical relationship, inflation would have to rise by 8.3% a year for the next 20 years to justify current prices. If inflation were to rise by its average since 1968 of 4.7%, gold would have to drop 3.6% a year for the next 20 years, according to Tim Courtney, chief investment officer at Burns Advisory Group. “This latest gold craze is way overdone,” he says.

It remains to be seen if gold prices would decline or gain further this year.

Five European Utility Stocks Trading Under $10

The following five European utilities trading on the OTC markets have dividend yields of over 3% and prices under $10. All of them are large companies in their respective countries. For example, Electricite de France SA (ECIFY) has a market cap of $80.4 billion.However ECIFY is not on the radar of most U.S. investors as it is traded on the OTC markets.  But the stock is fairly liquid with a daily average trading volume of over 100,000. So investors looking to gain some exposure to established European utilities that pay dividends can consider adding these stocks.

1. EVN AG (OTC:EVNVY)
Sector: Electric Utility
Country: Austria
Current Dividend Yield: 3.51%
Current Stock Price: $3.05

2. Verbund AG (OTC:OEZVY)
Sector: Electric Utility
Country: Austria
Current Dividend Yield: 3.28%
Current Stock Price: $8.05

3. Electricite de France SA (OTC:ECIFY)
Sector: Electric Utility
Country: France
Current Dividend Yield: 3.38%
Current Stock Price: $8.70

4. Gas Natural Sdg SA (OTC: GASNY)
Sector: Gas Utility
Country: Spain
Current Dividend Yield: 6.05%
Current Stock Price: $3.00

5. Enel (OTC:ENLAY)
Sector: Electric and Gas Utility
Country: Italy
Current Dividend Yield: 4.64%
Current Stock Price: $5.57

Disclosure: No Positions

A Review of Egyptian ADRs and ETF

pyramid-150×150.jpgThe situation in Egypt continues to unfold with President Mubarak dismissing his government today. As a result of the unrest, Egyptian equities have performed poorly so far this year. The stock market crashed 10% yesterday following another 6% fall the day before.  The EGX 30 Index is down about 21% YTD.

The only country-specific ETF  for Egypt is the Market Vectors Egypt Index ETF (EGPT). The ETF fell another 3.40% today on heavy volume. As of January 27th, the fund is down about 17% for the year. This ETF has a very small asset base of just $11.7 million.Out of the 29 holdings, the top three are Commercial International Bank Egypt, Orascom Construction Industries and Orascom Telecom Holding. Financials constitute about 46% of the portfolio.

The five Egyptian ADRs trading on the OTC markets in the U.S. are listed below:

1. Commercial International Bank (CIBEY)
YTD Change: -24.13%
Current Stock Price: $6.32

2.Orascom Construction (ORSCY)
YTD Change: -27.14%
Current Stock Price: $36.25

3.GB Auto S.A.E. (GBAXY)
YTD Change: -10.85%
Current Stock Price: $33.36

4.Lecico Egypt (LECIY )
YTD Change: -0.34%
Current Stock Price: $2.91

5.Remco Tourism Villages(RMTVY )

Related Links:

1. The Egyptian Stock Exchange

2. The Complete List of Egypt GDRs

3. Yahoo Finance – Egypt CMA General Index

4. Market Vectors’ The Egypt Index ETF official site.

5. EGX 30 Index Constituents list

6. Egypt Country Info at CIA’s The World Factbook site.

PFC Energy: The World’s Top 50 Listed Energy Firms 2010

The global energy consultancy PFC Energy has published the annual ranking of the world’s largest energy companies for 2010. The table below shows the top 25 firms:

[TABLE=876]

Source: PFC Energy

Note:

Market cap data is as of 12/31/2010.

* Prior listings ranked BHP-Billliton based on total market capitalization; this year the company is ranked by the estimated value of its E&P component based on reserves and production.

Some observations:

  • U.S oil giant ExxonMobil(XOM) retains the top position with a market cap of $368.7 billion.
  • Since PetroChina’s (PTR) market cap fell by 14% last year it fell to the second rank.
  • Brazil’s Petrobras (PBR) has jumped from 27th rank in 1999 to 3rd rank last yea. So its market cap has grown at compound annual rate of 27%.
  • Colombia’s state-owned Ecopetrol(EC) posted impressive market cap gains in 2010 propeling the company to the 13th spot. Accordingly Ecopetrol’s ADR soared from about $24 in January 2010 to close the year at about $44.

The complete list of the PFC Energy 50 can be found here.

Disclosure: Long PBR, EONGY

U.S. Smallcaps and Midcaps Outperform Largecaps

Generally small and mid-cap stocks perform better than large cap stocks due to the higher risk involved in them. Small and midcaps can be extremely volatile and are not suited for all investors. However instead of picking individual stocks, one simple way to gain gain exposure to them is via ETFs. A recent article in the Journal notes that smallcaps and midcaps have outperformed large caps in the last decade but their valuations look stretched after this great run up. Large caps look attractive at current levels.

From the article:

The S&P 500 has gained just 14.1%, including dividends, over the 10 years through Friday, and remains more than 20% off its 2007 high. The S&P 400, meanwhile, has surged 72% over the past decade, and traded at 939.56 on Monday, its highest ever. The S&P SmallCap 600 has jumped 77% during the period.

mid-large-caps.jpg

Source:The Wall Street Journal

In 2010, small and midcaps yielded double the total returns of S&P 500.

Related ETFs:
SPDR S&P 500 ETF (SPY)
iShares S&P SmallCap 600 Index Fund (IJR)
iShares Russell 2000 Index Fund (IWM)
Vanguard Small-Cap ETF (VB)

A complete list of Smallcap and Microcap ETFs can be found here.

Disclosure: No Positions