Why Soaring Energy and Food Prices Have Low Impact on CPI

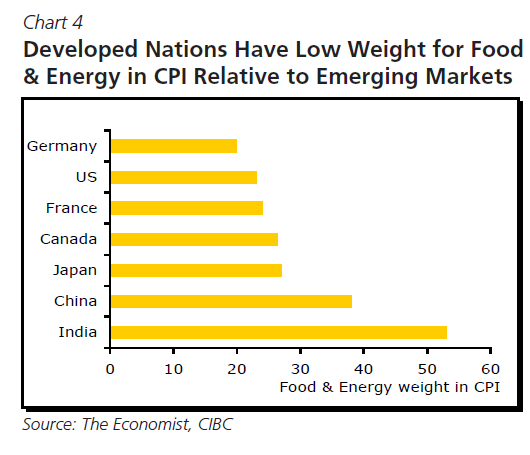
Soaring energy and food prices have low impact on Consumer Price Indices (CPI) in developed countries than in emerging countries. This is because unlike in the emerging markets, food and energy make up a lower share in the more service-oriented CPI baskets of developed countries. Emerging markets such as India, China, Brazil are experiencing high inflation rates now since energy and food prices have a higher allocation in their CPI calculations.

cpi-dev-em-markets.png

Source: US Treasuries and the Three Bears, CIBC World Markets

The following chart shows that many developed countries have the least exposure to food in their CPI calculations:

food.png

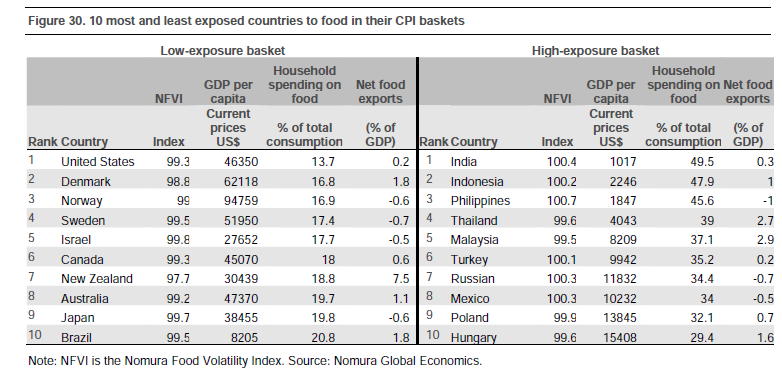
The emerging countries of India, Indonesia and Philippines are the top three countries with the highest exposure to food in their CPI baskets.

Source: Nomura Global Economics

Americans Are Now Saving More Than Canadians

Generally Canadians have a higher propensity to save compared to Americans in spite of having a better social safety-net such as free healthcare, pensions, job security, etc. under the socialist form of government. Up until the credit crisis hit most U.S. consumers saved very little. In fact, the personnel savings rate in the U.S. went negative a few years ago. As a consumer-driven economy Americans were bombarded with ads to spend their hard-earned money on all types of products and services that promised a rich-lifestyle and most obliged which kept the economy growing. However all that changed after the global financial crisis and the ensuing recession in which millions of jobs disappeared. As a result of the deleveraging process undertaken by American consumers, the savings rate has risen by over 3% in the past three years and the debt to income ration has decreased.

Canadians on the other hand have been saving less in recent years due in part to the soaring real estate prices. This “wealth effect” reduced savings and increased consumption. The Canadian savings rate averaged just 4.2% in the first three quarters of 2010. The American savings rate on the other hand is at near 6% which is 1.6% higher than the rate in Canada as shown in the graph below. This gap is the largest on record, according to a research report from CIBC World Markets.

us-canada-savings-rate.png

Source: 
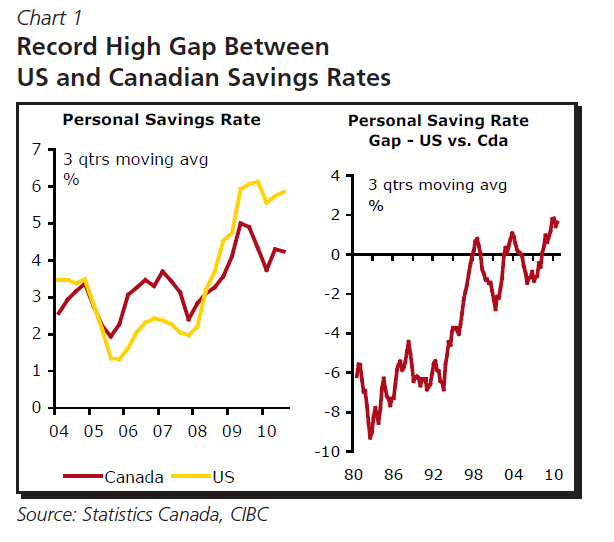
Back to Old-Fashioned Saving, Benjamin Tal, CIBC World Markets

The World’s Most Innovative Companies 2011

The Fast Company magazine has published the list of the world’s 50 most innovative companies for 2011. Innovation is critical to the success of most businesses especially in this fast-changing highly competitive environment. The magazine mentioned the following with the introduction of the list:

An artificial heart and its lightweight power drive. A better airline for Brazil. Chocolate from Madagascar and a soccer shirt made of plastic water bottles. A fashion leader escaping its pattern, a smelter, and that little coupon startup in Chicago that’s suddenly worth billions. All this from one simple word: innovation.

The World’s 50 Most Innovative Companies for 2011 are:

[TABLE=881]

Source: Fast Company

It is not surprising to see Apple (AAPL) take the top rank in this list. Apple’s market cap of $324.0 billion is higher than that of General Electric’s (GE) which is ranked at number 45. Other notable publicly-traded tech companies include Google (GOOG), Intel (CSCO), IBM (IBM), Cisco (CSCO), Microsoft (MSFT), Amazon (AMZN) and Netflix (NFLX). While these tech giants are highly innovative, from an investment standpoint not all of them have been best informers. In fact, stocks like Cisco and Microsoft have been dead money since the dot-com implosion.

Disclosure: No Positions

Union Membership in the U.S.: Public vs. Private Sector

The majority of the states in the U.S. are running deficits and hence are cutting government services when they are desperately needed by the middle and the lower classes in this sluggish economy. While the causes for the budget shortfalls are many, one of the main reason is that public workers at the state and local level are paid lavishly compared to their private sector peers. In addition to astronomical salaries, government workers get paid fat pensions when they retire, generous healthcare benefits during employment and after retirement,etc. The monthly pension amounts received by public workers are guaranteed regardless of the performance of equity/bond markets. In the private sector, most companies have eliminated defined pension plans in favor of 401-K and other contribution-type retirement plans.

Similar to the state and local public sector workers, Federal employees also receive above-market salaries and luxurious benefits. However despite being in deep debt like the states, the Federal government is able to “print” money of out thin air and pay such high packages to employees without any issues. States on the other hand have to depend on tax revenues in order to fund the massive labor costs. As tax revenues fall they find themselves in trouble and state workers who are used to the rich-benefits are unwilling to take any cuts.

Public workers are able to maintain the status quo because of the unions and their collective bargaining power. Unions fund politicians with millions of dollars in campaign contributions and then once in power politicians return the favor by agreeing to the demands of public workers and adding more burden on taxpayers. This is in sharp contrast to private sector workers where real wages have fallen for many years now and all the benefits due to productivity and technological advancements are reaped by a few at the top.

The following chart from a Journal article shows the rise of public sectors unions and the fall of private sector unions:

us-union-membership-private-public-sectors.jpg

Source: The Wall Street Journal

From the article:

“We first started running the nearby chart on the trends in public and private union membership many years ago. It documents the great transformation in the American labor movement over the latter decades of the 20th century. A movement once led by workers in private trades and manufacturing evolved into one dominated by public workers at all levels of government but especially in the states and cities.

The trend is even starker if you go back a decade earlier. In 1960, 31.9% of the private work force belonged to a union, compared to only 10.8% of government workers. By 2010, the numbers had more than reversed, with 36.2% of public workers in unions but only 6.9% in the private economy.

The sharp rise in public union membership in the 1960s and 1970s coincides with the movement to give public unions collective bargaining rights.”

With official unemployment rate hovering over 9% and falling wages levels in the private sector, it is high time that politicians take on the powerful public unions and abolish their collective bargaining power. Productivity and efficiency in the public sector have to be increased and the benefits and wages of public workers must be brought down to be in-line with the current market conditions.

Related:

Union Contracts, Not Pay, Are States’ Problem

CIBC: Canadian Stocks To Offer Best Returns This Year

Canada offers unique advantages over other developed countries. For example, unlike most European countries the country is blessed with many natural resources that emerging markets like China need,  a stable banking system, democratic political system and proximity to the U.S., the world’s largest consumer market.

An article in the Financial Times notes that the Canadian equity market is a good bet this year according to a research report released today by CIBC. From the article:

A new report from CIBC World Markets finds that Canadian stocks are likely to produce the best returns in light of what looks to be a longer-term bear market in bonds, and ongoing fiscal belt tightening in the U.S. and Europe.

“Relative to the U.S. or east Asia, Canada’s equity market carries more insurance against a worsening geopolitical climate in the Middle East, in the form of a larger basket of energy stocks and safe havens like gold shares,” said Avery Shenfeld, chief economist at CIBC, in his latest Economic Insights report.

In addition, Canada presents a good option given the ongoing spectre of inflation haunting emerging market economies.

“Inflation hasn’t run away to the upside, so the Bank of Canada can chart a more careful course of tightening than what might end up being seen in the emerging market economies,” Mr. Shenfled said. “The nation’s fiscal position, while still in need of growth-slowing belt tightening, isn’t as strained on either a deficit/GDP or net debt/GDP basis as that of the U.S. or Europe.”

Ten randomly selected dividend-paying Canadian stocks from different sectors are listed below:

1.Company: Transcanada Corp (TRP)
Sector: Natural Gas Utilities
Current Dividend Yield: 4.37%

2.Company: Manulife Financial Corp (MFC)
Sector: Life Insurance
Current Dividend Yield: 2.82%

3.Company: Telus Corporation (TU)
Sector: Telecom
Current Dividend Yield: 4.59%

4.Company: Encana Corp (ECA)
Sector: Oil and gas operations
Current Dividend Yield: 2.48%

5.Company: Canadian Pacific Railway Ltd (CP)
Sector: Railroads
Current Dividend Yield: 1.65%

6.Company: Teck Resources Limited (TCK)
Sector: Metals mining
Current Dividend Yield: 1.08%

7.Company: Brookfield Asset Management Inc (BAM)
Sector: Investment Services
Current Dividend Yield: 1.57%

8.Company: Enbridge Inc (ENB)
Sector: Oil Well Services & Equipment
Current Dividend Yield: 3.37%

9.Company: BCE Inc (BCE)
Sector: Telecom
Current Dividend Yield: 5.53%

10.Company: Magna International Inc (MGA)
Sector: Auto & Truck Parts
Current Dividend Yield: 1.99%

Note: Dividend yields noted above are as of Feb 28, 2011

Disclosure: No Positions