Performance: Gold vs. Major Other Asset Classes

Gold has been one of the best performing asset classes in recent years. Yesterday gold for June delivery rose $13.60 to close at t $1,486 an ounce for an increase 4.5% YTD.

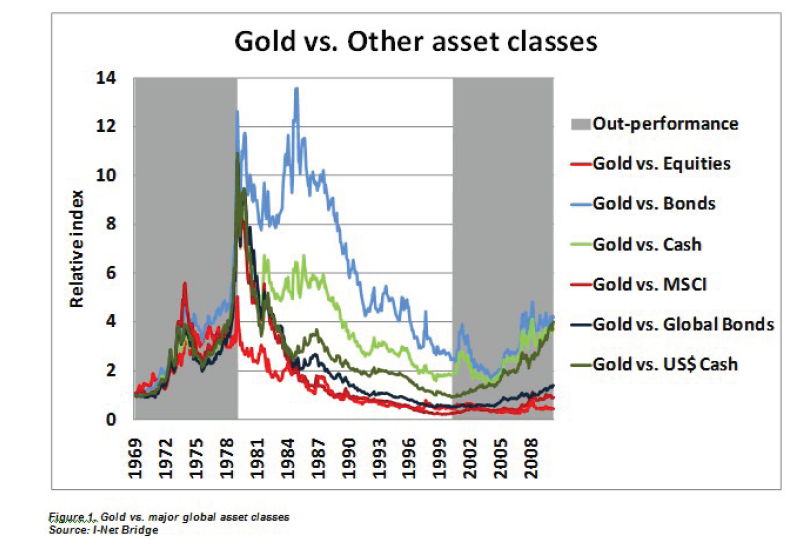
The chart below shows the performance of gold vs. major other asset classes since 1969:

Click to enlarge

Gold-vs-other-assets

Source:The PSG Angle, PSG Asset Management

Note: Cash represents South African Rand

Gold has out-performed cash, bonds and equity in the last decade (from 2001 to 2011). Despite the current high price of over $1,400 an ounce, many are projecting gold to reach the $2,000 in the next few years. It is also widely believed that if the US was to revalue its current gold holdings in order to cover its short-term liabilities, the theoretical price of gold would rocket to $20,000/ounce.

Related ETF:
SPDR Gold Trust ETF (GLD)

Disclosure: No positions

Companies with the Biggest Short Positions

According to a recent article in The Wall Street Journal, short-selling is on the rise again. Despite news of economic recovery and the stabilization of equity markets in the past few months some investors are betting that the markets would fall.

From the article:

Short selling rose at the New York Stock Exchange and at the Nasdaq Stock Market during the second half of March.

In the exchanges’ latest twice-a-month statistics, for the period ended March 31, the number of short-selling positions at the NYSE not yet closed out, known as short interest, increased 0.85%. The positions stood at 12,643,943,208 shares from a revised 12,537,409,289 shares in the period ended March 15.

On Nasdaq, short interest increased 1.60% to 6,668,223,829 shares from 6,563,218,369 shares over the same period.

12 Companies with the biggest short positions are noted below. It msut be noted that among the stocks listed SPY, IWM and XLF are ETFs.

1.Citigroup(C)
Shares shorted = 372 million
% of float = 1.3
Days to cover = 1

2.SPDR S&P 500 (SPY)
Shares shorted = 308 million
% % of float = N/A
Days to cover = 2

3.Sirius XM Radio (SIRI)
Shares shorted = 265 million
% of float = 7.0
Days to cover = 6

4.iShares Russell 2000 (IWM)
Shares shorted = 229 million
% of float = N/A
Days to cover = 4

5.Ford Motor (F)
Shares shorted = 153 million
% of float = 4.1
Days to cover = N/A

6.SPDR Select Sector Fund – Financial (XLF)
Shares shorted = 95 million
% of float = N/A
Days to cover = 1

7.Sprint Nextel (S)
Shares shorted = 94 million
% of float = 3.2
Days to cover = 1

8.PowerShares QQQ Trust Series 1 (QQQ)
Shares shorted = 91 million
% of float = 22
Days to cover = 1

9.Level 3 Communications(LLL)
Shares shorted = 89 million
% of float = 5.5
Days to cover = 5

10.Synovus Financial (SNV)
Shares shorted = 84 million
% of float = 10.9
Days to cover = 15

11.Microsoft (MSFT)
Shares shorted = 82 million
% of float = 1.1
Days to cover = 1

12.Nokia (NOK)
Shares shorted = 81 million
% of float = N/A
Days to cover = 4

Source: The Wall Street Journal

The complete list of short positions by exchange can be found in the Journal’s Mart Data Center page here.

Disclosure: No positions

Ten Components of the DAXglobal Austria Dividend Index

Among the smaller economies of Europe the country of Austria has some unique advantages. Many Austrian companies have high exposure to Eastern and Central European countries which have recovered after the credit crisis and are now in a better position than many developed European countries.Hence Austrian companies offer an efficient way to participate in the growth of these countries.In order to identify some of the top dividend-paying Austrian stocks I referred to the The DAXglobal® Austria Dividend Index.

This index “replicates the dividend strategy based on the Austrian Top 30 by market cap. It contains the top ten companies with the highest dividend yield. The members of the DAXglobal® Austria Dividend Index are adjusted annually in September based on recent dividend payments. The index shares are weighted at a maximum of ten percent, which prevents individual stocks from dominating the index.”

The 10 Components of the DAXglobal® Austria Dividend Index are:

  1. Telekom Austria AG
  2. OMV AG (OMVZY)
  3. Mayr-Melnhof Karton AG (MNHFY)
  4. Voestalpine AG (VLPNY)
  5. Erste Group Bank AG (EBKDY)
  6. Andritz AG (ADRZY)
  7. RAIFFEISEN INTL BK-HO.INH (RAIFY)
  8. Vienna Insurance GRP INH.(VNRGY)
  9. OESTERREICH. POST AG(OERCF)
  10. STRABAG SE (SBAGY)

A simple and easy way to gain exposure to most of the companies noted above is via the MSCI Austria Investable Market Index ETF (EWO). The fund has an asset base of about $216 million and portfolio has 31 holdings.

Disclosure: Long EBKDY

20 Foreign Stocks Paying More Than 5% Dividends

Currently the S&P 500 has a dividend yield of about 2%. Investors looking for higher yields can invest in overseas companies which offer much higher yields. Generally utilities and financials tend to have higher payouts. Though most foreign firms pay dividends once or twice a year, the paid out dividends will be significantly higher. Due to tax implications it is advisable to hold high dividend-paying foreign stocks in a taxable account.

To get started, the table below lists 20 exchange-listed foreign stocks  paying over 5% dividends:

[TABLE=898]

Note: The above list excludes companies from China and Canada.

Disclosure: Long BCA

A Look at the Global Wind Power Industry

Denmark is the one of the world leaders in producing electricity from wind. About 20% of the electricity produced in Denmark comes from wind power.Since the 1980s the Danish government provided various incentives for the growth of this industry with the goal of reducing fossil fuel imports. As a results of these efforts, today Denmark is not only a world leader in wind power generation but also is a major exporter of wind power technology and expertise to other countries.

In recent years, India and China have embarked on a mission to reduce their  fossil fuel imports and encourage the production of electricity form renewable energy sources. Today India has the fifth-largest installed wind capacity in the world with more than three-times the installed capacity of Denmark. However China is much ahead of India in this industry as well as shown in the chart below:

china-india-wind-power.jpg

China started installing wind power capacity in 2005. Now it is the largest domestic wind market achieving three times the installed capacity of India or ten times the capacity of Denmark in just five years.As in Denmark and India, China created strong incentives and supporting policies for private investment leading to the strong growth of this industry. The 12th Five‐Year Plan envisions a further increase of the 2020 target of wind power capacity to above 100 GW.

Source: Clean Energy Progress Report, IEA

Ten large global wind power companies are listed below:

1.Company:Vestas(VWDRY)
Country: Denmark
Current Stock Price: $12.93

2.Company:GE Energy (GE)
Country: USA
Current Stock Price: $20.19

3.Company:Gamesa (GCTAY)
Country: Spain
Current Stock Price: $2.10

4.Company: Enercon
Country: Germany
Current Stock Price: N/A

5.Company:Suzlon
Country: India
Current Stock Price: N/A

6.Company:Siemens (SI)
Country: Germany
Current Stock Price: $138.50

7.Company:Acciona
Country: Spain
Current Stock Price: N/A

8.Company:Goldwind
Country: China
Current Stock Price: N/A

9.Company:Nordex (NRDXF)
Country: Germany
Current Stock Price: $11.65

10.Company:Sinovel
Country: China
Current Stock Price: N/A

Disclosure: No positions