Global Cement Industry: A Brief Overview

Cement is one of the basic ingredient in the construction industry. The global cement industry is highly fragmented with many international, regional and local players competing in the market.The global majors account for only about one-fourth of the market. Due to increasing infrastructure and real estate development in emerging markets the cement industry is experiencing strong growth in the past few years.

According to one study:

Cement is made out of limestone, shell, clay mined out of a quarry close to the plant. The raw material is crushed, and then heated at temperature in excess of 1000 ºC in rotating kiln to become clinker. Clinker is then mixed with gypsum and ground to a fine powder to produce final grade of cement. The technology is a continuous process and is highly energy intensive.

Cost of cement is 29% energy, 27% raw materials, 32% labour and 12% depreciation.

Last year cement production worldwide increased by an estimated 9.9% from 2009 to reach 3.3 billion tons with China driving growth. Rising demand led to the construction of 140 new plants over the past two years.

The top five cement consuming countries in 2010 were:  China, India, USA, Brazil and Iran.

The top five cement producing countries in 2010 were:  China, India, USA, Turkey and Iran.

Due to lower production capacity or lack of plants, some countries are major importers of cement. The top five importers last year were: Bangladesh, Nigeria, USA, Iran and Afghanistan.

The top five cement exporters were: Turkey,  China, Thailand, Japan and Pakistan.

Some of the leading global cement companies include:

1.Lafarge (LFRGY)
Country: France
LaFarge is the world’s number one producer of cement and related materials with operations in 78 countries.

2.Holcim
Country: Switzerland

3.HeidelbergCement
Country: Germany

4.Cemex (CX)
Country: Mexico

5.Italcementi
Country: Italy

6.Buzzi Unicem
Country: Italy

Source: International Cement Review

Some of the other cement firms trading on the US markets are:

1.Cementos Lima (CEMTY)
Country: Peru

2.CRH NV (CRH)
Country: The Netherlands

3.Empresas ICA (ICA)
Country: Mexico

4.James Hardie Industries (JHX)
Country: Australia

5.Wienerberger(WBRBY)
Country: Austria

Disclosure: Long LFRGY
Should Investors Avoid Bank Stocks in BRIC Countries ?

The MSCI Emerging Markets Index allocates about 25% to the banking sector because this sector forms an significant part of these growing economies. However some investors including professional fund managers tend to avoid banks in the emerging countries for many reasons including their high exposure to the real estate industry, worries about adverse impacts to earnings due to rising interest rates, etc.

UK-based Jonathan Asante of First State Global Emerging Markets Leaders Fund stated the following as the reason for being underweight in emerging markets banking:

“We are suspicious of banks in a number of GEMs because they are generally arms of the government. They are forced to lend to the people in times of crisis. Though that is great news for the people it does not help minority shareholders like ourselves.”

Note: GEM – Global Emerging Markets

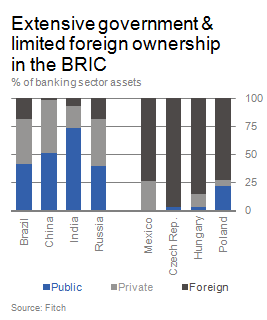
The banking sector is highly controlled by states in the BRIC countries. Accordingly the majority of the banking assets are held by the state-owned banks as shown in the chart below:


Source: BRIC banking systems after the crisis, Deutsche Bank Research

About 75% of banking sector assets in India is under the state control. China’s public-sector banking ownership is just over 50%. In Brazil and Russia also a high portion of this sector remains under state control. In all these countries, the government considers banking as a strategic industry and hence plays an active role in lending credit to the economy by using state-controlled banks.  During the credit crunch of 2008-09, public-sector banks in BRIC increased lending and helped maintain the stability of the economy. As a result of the high government role in this sector, real credit growth averaged almost 25% in China in 2009-10, while public-sector banks in Brazil doubled lending from 10% of GDP in 2008 to 20% of GDP in 2010.

According to Markus Jaeger, author of the DB Report, state-led economic development including lending by state-controlled banks is appropriate during the early “catch-up” phase of economic growth “when per-capita income is low and growth is significantly driven by large-scale investment in physical infrastructure and the introduction of “off-the-shelf” technologies.” However as per-capita income rises, private-sector banking and market-based credit allocation will lead to superior economic growth. As all the BRIC countries are still in the “catch-up” phase, large public-sector ownership of the banking sector is not highly negative.

Private-sector banks in BRIC countries are also performing extremely well despite exponential growth in assets in the past few years. Unlike banks of the developed world, private-sector banks in BRIC have recovered strongly from the credit crisis and their balance-sheets are in a much healthier position. One reason for their success is that most of these banks follow traditional lending practices and maintain strict discipline in reducing risks.

Hence investors should not avoid bank stocks in BRIC. Instead they can add them selectively at current or lower prices.

Some of the banking stocks from Brazil, Russia, China and India are listed below with their current yields:

1.Bank: Banco Santander Brasil SA (BSBR)
Current Dividend Yield: 4.34%
Country: Brazil

2.Bank: Banco do Brasil SA (OTC:BDORY)
Current Dividend Yield: 6.12%
Country: Brazil

3.Bank: Itau Unibanco Holding SA (ITUB)
Current Dividend Yield: 2.17%
Country: Brazil

4.Bank: Bank of China Ltd (OTC:BACHY)
Current Dividend Yield: 4.68%
Country: China

5.Bank: China Construction Bank Corp (OTC:CICHY)
Current Dividend Yield: 4.07%
Country: China

6.Bank: ICICI Bank Ltd (IBN)
Current Dividend Yield: 1.33%
Country: India

7.Bank: HDFC Bank Ltd (HDB)
Current Dividend Yield: 0.64%
Country: India

Disclosure: Long BBD, ITUB

No, There Is No Economic Recovery !

The Global Financial Crisis (GFC) of 2008 wiped out millions of jobs worldwide. In the U.S., the ground zero for the crisis, companies laid off hundreds of thousands of workers. While the media, politicians, regulators, company executives and others hyped that the economy recovered in 2009, in recent weeks doubts have been raised if there was a recovery at all.

The U.S. economy entered a recession from December 2007 thru June 2009, according to National Bureau of Economic Research (NBER). The recession that lasted for 18 months was the longest since World War II. In addition to severe decline in private sector jobs, wages fell and duration of unemployment remained long as competition became intense for any job that was available.

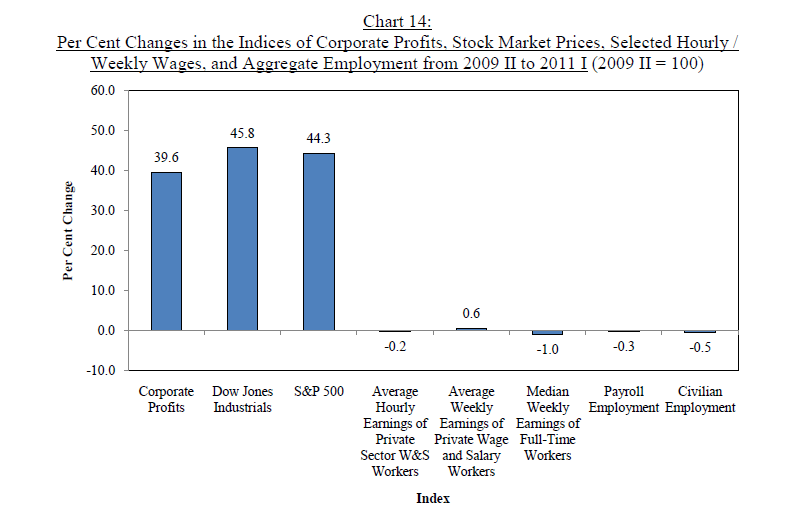
As of June this year, the official unemployment rate stood at 9.2% and the number of unemployed persons continued to remain high at 14.1 million. Unofficial figures are much higher. Meanwhile U.S. corporations hold over $1 Trillion of cash overseas and corporate profits have been increasing consistently since the second quarter of 2009. Corporate profits rose from $1,203 billion in 2Q, 2009 to $1,667 billion in 4Q, 2010. So in the first seven quarters of this “recovery” profits at U.S. companies surged by about $465 billion. Accordingly the Dow Jones Industrial Average rose from 8,447 at the end of 2Q, 2009 to 12,319 at the close of 1Q, 2011 for an increase of 46%. Similarly the S&P 500 gained 44%  in the same period.

While corporate profits and stock markets have soared, growth in wages and jobs have been virtually non-existent as shown in the horrendous chart below:

Click to enlarge

Source:

The “Jobless and Wageless” Recovery from the Great Recession of 2007-2009: The Magnitude and Sources of Economic Growth Through 2011 I and Their Impacts on Workers, Profits, and Stock Values

by Andrew Sum, Ishwar Khatiwada, Joseph McLaughlin and Sheila Palma

Center for Labor Market Studies, Northeastern University, Boston, Massachusetts

Some key takeaways from the research report:

  • “The absence of any positive share of national income growth due to wages and salaries received by American workers during the current economic recovery is historically unprecedented.
  • Pre-tax corporate profits by themselves had increased by $464 billion while aggregate real wages and salaries rose by only $7 billion or only .1%.
  • To date, through the first quarter of 2011, the nation’s recovery from the 2007-2009 recession is both a jobless and a wageless recovery.”

So in summary there is no real economic recovery – meaning no growth in jobs, wages, consumption, etc. Instead we have had a tremendous recovery in equity markets and corporate profits which only benefit the wealthy and elite of this nation. The rest of the public faces a long and uncertain future unless some bold and sensible policy changes occur which seems unlikely under the “Change We Can Believe In” Obama administration.

Bank Director: America’s Top 150 Banks 2011

The Bank Director magazine has published the Bank Performance Scorecard ranking the top 150 banks among the publicly-listed banks based on 2010 earnings data. The scorecard analyzed banks in three critical areas: profitability, capital and asset quality.

From the Bank Director report:

The Scorecard uses two standard measurements of profitability, return on average assets (ROAA) and return on average equity (ROAE). Unlike past rankings, this year’s Scorecard uses only one measurement of capital—the ratio of tangible common equity (TCE) to tangible assets—in recognition of how important that metric has become as federal bank regulators pressure banks to significantly boost their levels of common equity. Tangible common equity is defined as a company’s GAAP book value minus goodwill and other intangibles. It is, in other words, the actual hard dollar amount of common equity that a company has available to it.

Asset quality is also critically important since lending is the banking industry’s bread-and-butter business, and this is gauged using two metrics—the ratio of non-performing assets (NPAs) to loans and other real estate owned, and the ratio of net charge offs (NCOs) to average loans.

Banks that place high on the Scorecard generally do well in all three areas, rather than dominating a single area. As capital ratios have increased in recent years, the interplay between capitalization and profitability is especially telling. A bank that scores well on the two profitability metrics in part because it has leveraged its capital could end up with a lower overall score than a bank that has a higher level of profitability and higher capital.

The Top 10 banks are listed below together with their current dividend yields:

[TABLE=1030]

Source: Bank Director

The winner of this year’s ranking is Macon, Georgia-based State Bank Financial Corp (STBZ). The bank took advantage of the depressed banking market in Georgia by acquiring Security Bank Corp, a failed institution in the local region. Abilene, Texas-based First Financial Bankshares Inc (FFIN) took the second place this year. In November last year, First Financial acquired Sam Houston Financial Corp., a $163-million-asset bank in Huntsville, Texas, for $22.2 million. Charleston, West Virginia-based City Holding Company (CHCO) came in at third place since the bank faced lesser competition in the home market and the real-estate portfolio remained strong as the housing market did not over inflate during the bubble years.  In addition the bank is extremely well positioned in the local community with an average of 2,200 households per branch compared to an industry average of 1,200.

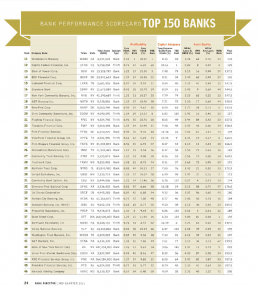
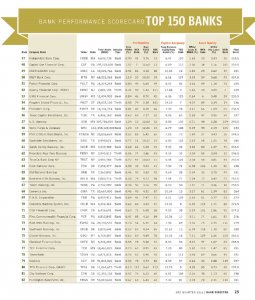
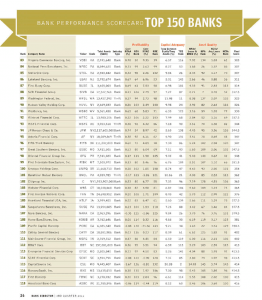
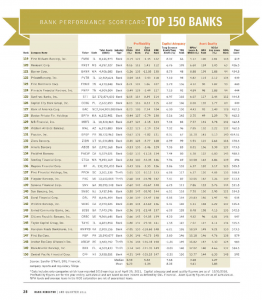
The rest of the Top 150 banks are listed in the screenshots below:

Click to enlarge

Since hundreds of bank stocks trade on the US markets and it is a very difficult sector to evaluate now, investors looking to bank stocks to their portfolios can use the above list as a starting point for further research.

Disclosure: Long GBCI, FBP, DRL, FITB, BBT, PNC, USB, UBSH

Should Investors Consider The Too-Big-To-Fail Concept In Making Investment Decisions?

The Too Big To Fail (TBTF) concept is the belief that certain financial institutions are so big and so complex that their failure will be be disastrous to the whole economy. Some of these institutions are indeed so huge that their failure is unimaginable and may wreck the economies of many countries in addition to their domestic economies. Hence in the interest of saving the economy and contrary to economic principles, governments prop them up even if they are about to collapse due to their own reckless actions.

In the U.S., the TBTF concept was put into action during the recent credit crisis when certain financial institutions were saved from collapse. For example, Citigroup (C) and Bank of America (BAC), two of the super-banks were bailed out by Uncle Sam in order to save the economy. Institutions such as Citi and BofA are like giant a octopus that spread its tentacles into every country and every business possible from traditional banking to exotic derivatives to insurance and many others in between. Similar scenarios played out in other countries such as the UK, France, Germany, The Netherlands, etc. where failed TBTF lenders were bailed out in the interest of common good. So investors in these TBTF institutions were protected by the behavior of the respective governments. However while these banks were saved many smaller institutions were allowed to  failed. In the U.S. for example, National City Bank, Washington Mutual, Lehman Brothers, Countrywide Financial, Fannie Mae, etc. and many other tiny banks failed as they were considered non-TBTF institutions and were sacrificed for their sins. Accordingly investors in these companies were wiped out for the most part as the state failed to bail them out.

So should investors consider the TBTF theory when making investment decisions?

The answer to the above question is it depends. At the financial institutions level the theory can be considered as one factor when selecting a company for investment. However it cannot be applied to at the country level.

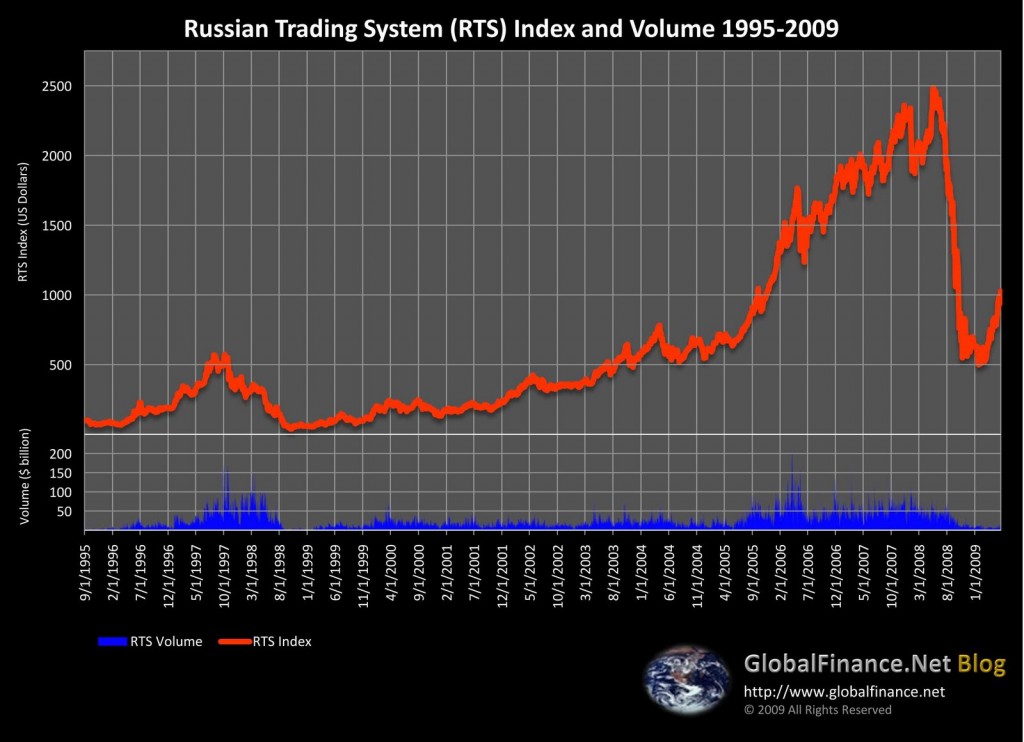
In the early 1990s global investors were attracted to the Russian market after private enterprises bloomed with the fall of communism. By late 1997, the main RTS index peaked at 571, making it the hottest emerging market in the world at that time. But one year later it crashed to an all-time low of 37. The daily trading volume of all shares traded at the stock exchange plunged to just $2 million. The collapse of the Russian equity market was triggered when the government defaulted on bonds and the rubble went into a free fall. Equity investors in the Russian market lost their investments.

RTS Index Chart 1995 – 2009

Click to enlarge


Source: Global Finance Blog

Following the logic of Too-Big-To-Fail theory, investors falsely believed that a nuclear-power such as Russia would never let the economy fail especially since the country of 144 million was just enjoying the early stages of free-market capitalism. However they were proven wrong and the TBTF theory failed miserably when applied at a country level.

From Russian Crash Shows Globalization’s Risks published by The Washington Post in November 1998:

On April Fool’s Day 1998, IMF Managing Director Michel Camdessus, in a speech to the U.S.-Russia Business Council, complained that “cozy relationships” with the government were allowing businesses to avoid paying taxes and compared Russia’s system to the “crony capitalism” of South Korea. “The continued large fiscal deficit leaves Russia highly vulnerable to swings in market sentiment,” he said.

But most investors weren’t listening. One emerging market analyst who left a job at one investment bank to go to another, said, “If markets are going up, there are big bonuses and everybody is happy. If you’re a Cassandra, you could deter money from coming in. People don’t want to hear that kind of thing. They don’t want to hear the bad news.”

In the U.S. banking business, there is a concept known as “too big to fail.” It applies to a handful of banks so big that most investors expect that the U.S. government would bail them out to prevent a broad financial panic even though the U.S. government has no legal obligation to come to the banks’ rescue.

A version of that philosophy applied to Russia. Investors thought it was too great a nuclear power to fail.

(emphasis added)

Update:

On July 1, 2011 Russia bailed out Bank of Moscow with $14.4 billion making it the biggest bailout in the nation’s history according to a report titled The Russian Edition of Too Big to Fail in the latest issue of Bloomberg BusinessWeek.

Disclosure: No Positions

Related ETF:

Market Vectors® Russia ETF (RSX)