How Big Is The Global Financial Industry

Der Speigel has published an excellent report titled The Destructive Power of the Financial Markets discussing the size and power of various players on the global financial markets.

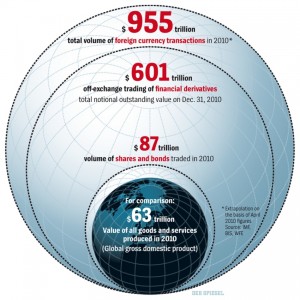
The graphic below shows the astonishing size of the global financial industry:

Click to enlarge


From the report:

The financial industry grew rapidly, as did the sums of money with which its players speculated on the prices of stocks, commodities and government bonds. The products they developed to turn money into even more money became more and more complex. At the same time, the risks they were willing to accept became incalculable.

The sector’s high salaries tend to attract the best and brightest university graduates. The members of this youthful elite don’t devise new products that make people’s lives better, nor do they found new companies that further progress. Instead, these young financial wizards invest a great deal of money and effort to develop sophisticated financial products, the sole purpose of which is to generate more profit for both their employers and, ultimately, for themselves — sometimes at the expense of other market players or even their customers.

Many things that happen on Wall Street and in London’s financial district are “socially useless,” says Lord Adair Turner, chairman of Britain’s Financial Services Authority (FSA). The values that are created there are often not real or of any use to society, Turner adds. Paul Volcker, the former chairman of the US Federal Reserve, once remarked that the only truly useful financial innovation in the past 20 years is the cash machine. (emphasis added)

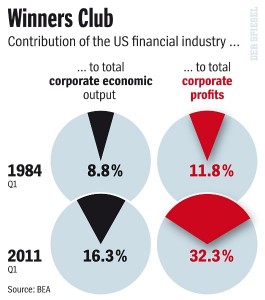
In the U.S. as the manufacturing industry was decimated in the past few decades, the financial industry gained prominence and started to account for a large portion of the economic output. By the first quarter of 2011, the industry accounted for about one-third of all corporate profits as shown in the graphic below:

Click to enlarge

Source: Der Speigel

The high reliance of the US economy on this one sector poses significant risks to the overall health of the economy. A strong economy should be diversified among many industries and not have over-concentration of just one industry.
Are U.S. Stocks Cheap Now?

The S&P 500 is down 10.7% YTD. Among the sectoral indices, the financials are the worst performers with the KBW Bank Index off 32% YTD.

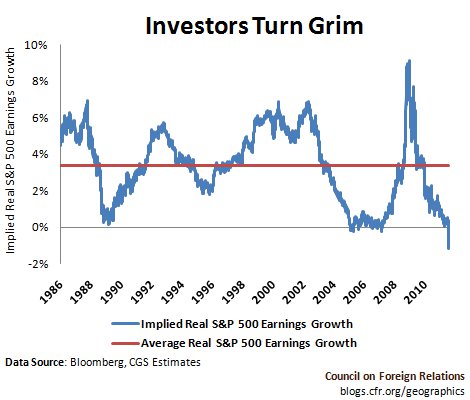
As U.S. equities continue their downward trend, some investors are wondering if they are cheap now. The following chart from a CFR report shows that stocks are either cheap or the market is assuming corporate earnings growth to be sluggish in the future:


Source: Are Stocks Cheap?, CFR

From the CFR report:

As the figure above shows, equity prices of late imply the worst earnings growth rate expectations in 25 years—such expectations even turned negative last week.  This dour outlook stems partly from renewed risk-aversion, which ironically redirected cash into downgraded U.S. debt, but it also reflects a sharp rise in concerns about where new profits will come from.  Operating margins and profits are near all-time highs, but revenues are still below their 2008 peak and real consumer spending has grown by only 2% over the past year.  Corporations currently have strong balance sheets and the lowest net debt-to-revenue ratio on record, but this is largely the result of cost-cutting which may have run its course.  In short, either stocks are very cheap or growth prospects very dim.

Currently the PE Ratio for S&P 500 stands at 19.39 and the Dividend Yield for the index is at 2.17%. While the U.S. and the developed world economies remain stuck in neutral or have negligible growth emerging markets are still growing at a robust pace. So investors looking to add some equities to their portfolios can consider adding U.S. companies which have high exposure to emerging markets and do not depend heavily on the domestic market. A list of 25 such companies can be found here.

Related ETF:

SPDR S&P 500 ETF (SPY)

Disclosure: No Positions

Which U.S. President Accumulated The Most Debt?

The current total outstanding U.S. public debt is over $14.0 Trillion. This huge mountain of debt was accumulated over many decades under the leadership of various presidents.

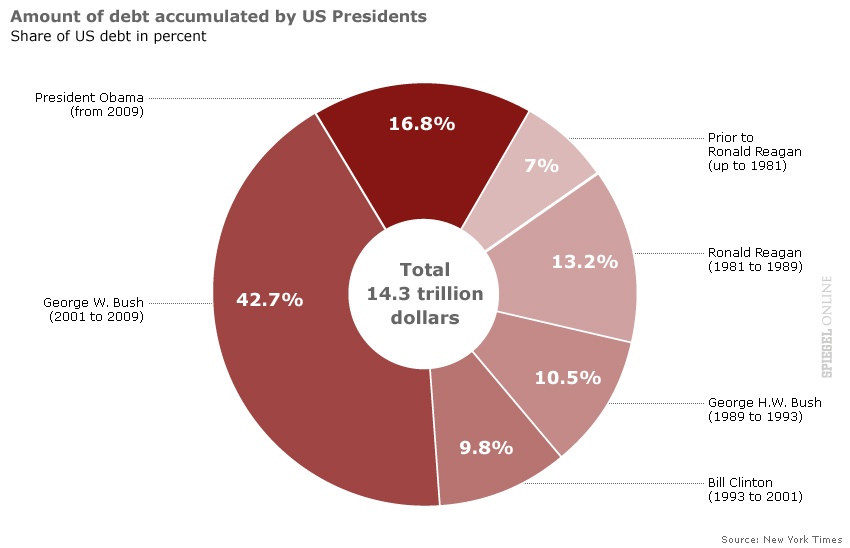
The graphic below shows the amount of debt accumulated by US presidents:

Click to enlarge

Source: Der Speigel

As shown above, the largest amount of debt was accumulated by the previous president George W.Bush during his term in office primarily due to big tax cuts for the rich and increasing government expenditures.

In early 2009, while attending a diamond-studded $800-a-plate crowd in New York Mr.Bush said:

“This is an impressive crowd – the haves and the have-mores,” quipped the GOP standard-bearer. “Some people call you the elites; I call you my base.

In May this year, the former Republican Vice Presidential Candidate and current Governor of Alaska Sarah Palin made the following claim in an interview to Fox News:

“Look at the debt that has been accumulated in the last two years,” Palin, a Republican, told Fox News’ Greta Van Susteren on May 31, 2011, as her bus rolled down the highway. “It’s more debt under this president than all those other presidents combined.”

This statement is factually incorrect. Hopefully the Republican party will be able to field a better vice-presidential candidate for the 2012 election.


Are Canadian Banks Better Than European and American Banks?

The Canadian banking system remained strong and stable during the Global Financial Crisis (GFC) of 2008. Unlike many European and American banks, banks in Canada did not require any form of bailout and the regulatory system won praise from many countries and global institutions such as the IMF. Since then however some have raised doubts about the strength of the Canadian banking system. I wrote a couple of articles on this subject last year which can be found here and here.

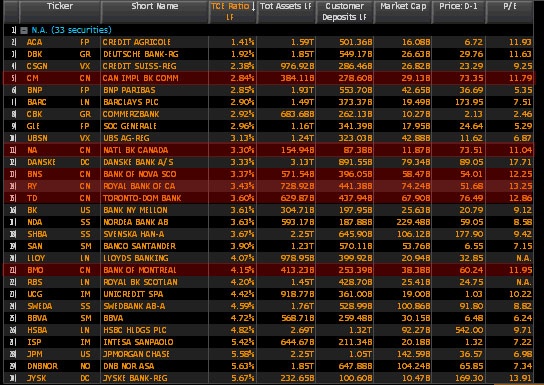
Recently Tyler Durden of Zero Hedge wrote an article saying that the majority of Canadian banks are also in bad shape based on the Tangible Common Equity(TCE) ratios. The following chart shows the top global banks ranked by TCE ratios with the lowest at the top:

Click to enlarge

Source: Zero Hedge

Except Bank of Montreal, all the other four Canadian banks have TCE ratios of less than 4%. Tyler looked for banks that will have their equity wiped out with a reduction of 4% or less in their value of assets. Based on this logic, except Bank of Montreal Canadian banks are just as risky as their European and American peers.

In an article titled Is Zero Hedge looking at the wrong numbers? Boyd Erman of The Globe and Mail argues that Zero Hedge may have looked at the wrong numbers to make that conclusion. From the article:

In a simple analysis that generated a great deal of commentary, a blogger at Zerohedge.com, an oddball but widely followed financial site, suggested that Canadian banks were as leveraged as European banks because they have low ratios of tangible common equity to total assets.

But there’s an argument that looking at that ratio is the wrong way to judge a bank’s strength because it ignores the composition of the assets.

A better number might be the ratio of tangible common equity to risk-weighted assets.

In times of stress, analysts have focused on tangible common equity as a baseline measure of strength. It is calculated as the amount of equity a bank has, after excluding preferred equity and intangibles (whose value might be questionable in a crisis). Set that tangible equity against a bank’s assets, and you can see how much wiggle room a bank has if its assets start to go bad.

But what’s the best measure of assets? Is it total assets, as the Zero Hedge analysis assumes, or is it risk-weighted assets?

An argument for total assets and against risk-weighted is that risk-weighted involves judgement calls on the riskiness of loans and investments. In many cases, the judgements are made by banks and overseen by regulators. Assets such as Treasury bonds are judged much less risky than a loan to a consumer, for example. Banks with low-risk assets can carry less equity.

There’s no judgement in total assets. They are an absolute.

The argument the other way runs that by using total assets you are lumping in Canadian banks’ assets like mortgages with the Greek bonds on the balance sheets of European banks. In other words, while you think you’re getting an apples to apples comparison, you’re not adjusting for the fact that some apples are fresh and tasty and some are rotten.

Interestingly, a 2009 study by McKinsey found that, when looking at the global banking crisis from 2007 to 2009, the ratio of tangible common equity to risk-weighted assets was the best predictor of bank distress.

To answer my title question I would say that Canadian banks are indeed better than European and American banks based on the above analysis and many other factors. For example, mortgage loans in Canada are full recourse loans and hence banks can go after homeowners if they default on their mortgages. Canadian banks also have effective risk management policies and do not engage in reckless lending (subprime) or play the derivatives market.

Bank of Nova Scotia(BNS), Bank of Montreal(BMO), Canadian Imperial Bank of Commerce(CM) and Royal Bank of Canada(RY) currently have dividend yields of over 4% and Toronto Dominion Bank(TD) yields close to 4% based on Friday’s closing prices. TD is expanding big in the U.S. and Scotia bank has a strong presence in the Caribbean and Latin American countries.

Related article:
Canada’s banks: Next dominos to fall?

Disclosure: Long BNS, BMO, CM, RY, TD