Which Country is a Better Investment: Brazil or India ?

The emerging markets of Brazil and India are vastly different in many ways. Brazil is not only blessed with many natural resources that the world wants but is also increasingly becoming as an exporter of manufactured goods. But Brazil has a small population compared to India.

India on the other hand has limited natural resources but traditionally has had a large manufacturing sector. With a huge population India offers bigger market for growth.

For foreign investors, both the countries offer a wide variety of choices for investment from banking to consumer goods to real estate sectors. However the Brazil is ahead of India in terms of equity market performance based on the MSCI country indices.

Multi-year performance of MSCI India and Brazil indices:

Click to enlarge
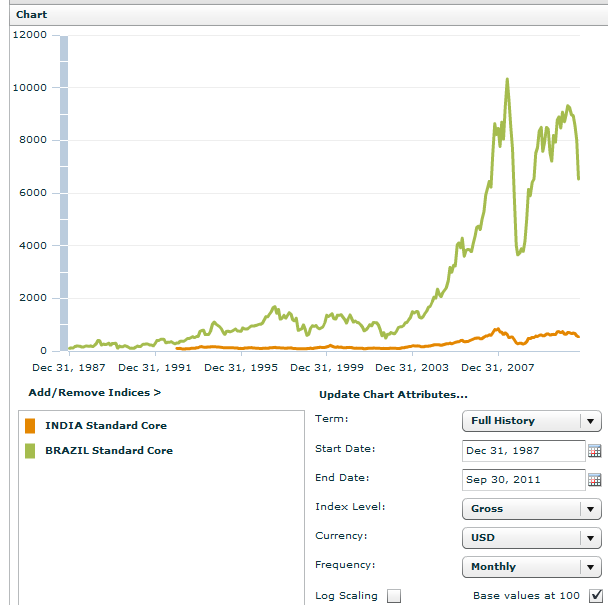
 

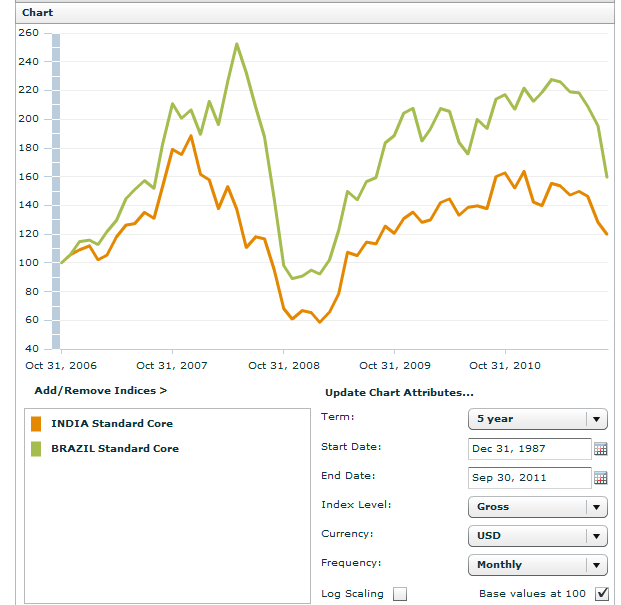
5-year performance of MSCI India and Brazil indices:
Source: MSCI

The long-term performance of Brazil and India are incomparable as shown in the first chart. One reason for this huge gap between them could be that India adopted free-market economic policies only in the 1990s and for many years even after that discouraged foreign investment in a number of key sectors of the economy.

The 5-year chart shows that the equity market performance of Brazil and India tracked each other though Indian stocks always lagged. Brazilian stocks fell heavily at the height of the credit crisis in 2009, but have recovered better than Indian stocks.

The equity market performance of the next five years will be closely watched by investors as both countries are projected to have strong economic growth and continue to attract high foreign direct investment. Since each country has its own unique risks and certain sectors offer higher potential for growth than others, investors must evaluate and invest in individual companies (or) sectors rather than simply going with country-specific funds.

Related ETFs:
EGShares India Infrastructure ETF (INXX)
EGShares Brazil Infrastructure ETF (BRXX)
iShares MSCI Brazil Index (EWZ)
Market Vectors India Small-Cap Index ETF (SCIF)
WisdomTree India Earnings (EPI)
PowerShares India (PIN)
iShares S&P India Nifty 50 (INDY)

Disclosure: No positions
IMF: Income Inequality Worsens in Most Developed Countries

Originally I had scheduled the article below for posting on next Friday. After reading yesterday’s The New York Times editorial on Occupy Wall Street protests I decided to publish it today.

From the Times editorial:

Extreme inequality is the hallmark of a dysfunctional economy, dominated by a financial sector that is driven as much by speculation, gouging and government backing as by productive investment.

When the protesters say they represent 99 percent of Americans, they are referring to the concentration of income in today’s deeply unequal society. Before the recession, the share of income held by those in the top 1 percent of households was 23.5 percent, the highest since 1928 and more than double the 10 percent level of the late 1970s.

That share declined slightly as financial markets tanked in 2008, and updated data is not yet available, but inequality has almost certainly resurged. In the last few years, for instance, corporate profits (which flow largely to the wealthy) have reached their highest level as a share of the economy since 1950, while worker pay as a share of the economy is at its lowest point since the mid-1950s.

Income gains at the top would not be as worrisome as they are if the middle class and the poor were also gaining. But working-age households saw their real income decline in the first decade of this century. The recession and its aftermath have only accelerated the decline.

Research shows that such extreme inequality correlates to a host of ills, including lower levels of educational attainment, poorer health and less public investment. It also skews political power, because policy almost invariably reflects the views of upper-income Americans versus those of lower-income Americans.

Original Article:

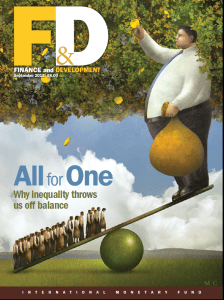
The latest edition of IMF’s Finance & Development magazine is mainly focuses on Income Inequality and its impacts. One can gain a wealth of knowledge from reading many of the articles related to this topic in this excellent issue.

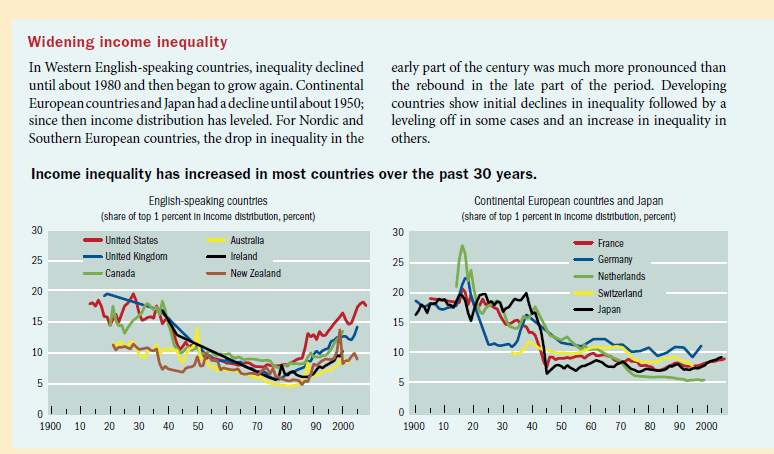
Income inequality declined in the first half of the 20th century. But it is making a comeback in most of the countries around the world. This is especially striking in the case of developed world where income inequality has increased in the past 30 years.


Click to enlarge

In the beginning of the 20th century, the top 1 percent of earners were capital owners. But by the end of the century the hired hands  – the top executives of corporations – shared the biggest share of the income distribution with capital owners. In this U.S., this setup continues to worsen as shown in the chart below:


Unlike some of the original capitalists like J.P. Morgan, David Rockefeller or Andrew Carnegie, today’s top executives do not invest their own capital and take huge risks to accumulate the outsized rewards. Instead fabulous wealth are legally transferred from companies to the pockets of these executives on a daily basis supposedly for their magical talent. Some examples of this modern-day “capitalists” with outlandish compensation in 2010 include Philippe P. Dauman of Viacom with $84.5 million, Ray R.Irani of Occidental Petroleum with $76.1 million, Lawrence J.Ellison of Oracle with $70.1 million, etc. (Source: The Pay at the Top, New York Times).

Update: Yesterday Bank of America (BAC), the Too-Big-To-Fail bank that still survives, announced that it will pay Sallie L. Krawcheck, the fired wealth-management division head a sum of $6 million. This latest scam case illustrates how the same banks that triggered the credit crisis and were bailed out by the state have not learned a single thing from their own near-death experience.

From the F&D article Inequality over the Past Century:

The dramatic increase in recent decades in the share of income going to the top 1 percent in many countries is due to a partial restoration of capital incomes and, more significantly, to very large increases in compensation for top executives. In the United States, as a result, the working rich have joined capital owners at the top of the income hierarchy.

In the United States, average real incomes grew at a 1.3 percent annual rate between 1993 and 2008. But if the top 1 percent is excluded, average real income growth is almost halved, to about 0.75 percent a year. Incomes of the top 1 percent grew 3.9 percent a year, capturing more than half of the overall economic growth experienced between 1993 and 2008. During the expansions of 1993–2000 and 2001–07, the income of the top 1 percent grew far more quickly— at an annual rate of more than 10.3 percent and 10.1 percent, respectively—than that of the bottom 99 percent, whose incomes grew at a 2.7 percent annual rate in the earlier expansion and 1.3 percent in the later one.

What is Kuznets Curve?

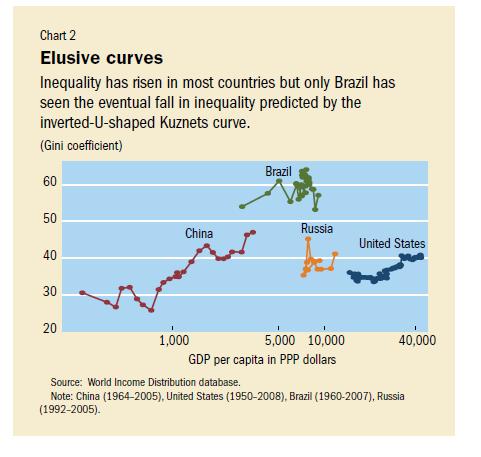
The Kuznets curve, formulated by Simon Kuznets in the mid-1950s, argues that in preindustrial societies, almost everybody is equally poor so inequality is low. Inequality then rises as people move from low-productivity agriculture to the more productive industrial sector, where average income is higher and wages are less uniform. But as a society matures and becomes richer, the urban-rural gap is reduced and old-age pensions, unemployment benefits, and other social transfers lower inequality. So the Kuznets curve resembles an upside-down “U.”

Based on the Kuznets curve theory also “the United States—the richest large country in the world—is one paradigmatic case of rising inequality” according to another article in the magazine. As China’s economy was liberalized in 1978, inequality surged and eventually surpasses that of the U.S. as shown in the chart below:

Source: Finance & Development, September 2011, IMF

Disclosure: No positions

The World’s 50 Biggest Banks by Assets for 2011

The Global Finance magazine has published its annual ranking of the world’s biggest banks for this year based on total assets the end of 2010.

The top 50 banks hold assets of just over $61 Trillion. China’s banks continue to grow in size. This year, ICBC, China’s biggest bank entered the top 10 ranks by taking the 9th place.

World’s 50 Biggest Banks 2010
Rank Bank Country Total Assets ($m) Statement Date
1 BNP Paribas France 2,669,906 12/31/10
2 Deutsche Bank Germany 2,546,272 12/31/10
3 HSBC Holdings United Kingdom 2,454,689 12/31/10
4 Barclays United Kingdom 2,331,943 12/31/10
5 The Royal Bank of Scotland Group United Kingdom 2,275,479 12/31/10
6 Bank of America United States 2,268,347 12/31/10
7 Crédit Agricole France 2,129,248 12/31/10
8 JPMorgan Chase United States 2,117,605 12/31/10
9 Industrial & Commercial Bank of China (ICBC) China 2,032,131 12/31/10
10 Citigroup United States 1,913,902 12/31/10
11 Mizuho Financial Group Japan 1,890,220 03/31/11
12 Bank of Tokyo-Mitsubishi UFJ Japan 1,687,313 03/31/10
13 ING Group Netherlands 1,666,368 12/31/10
14 China Construction Bank China 1,632,261 12/31/10
15 Banco Santander Spain 1,626,805 12/31/10
16 Bank of China China 1,579,346 12/31/10
17 Agricultural Bank of China* China 1,568,722 12/31/10
18 Lloyds Banking Group United Kingdom 1,552,245 12/31/10
19 Société Générale France 1,512,657 12/31/10
20 UBS Switzerland 1,401,924 12/31/10
21 Groupe BPCE France 1,400,911 12/31/10
22 Wells Fargo United States 1,258,128 12/31/10
23 Sumitomo Mitsui Banking Corporation Japan 1,247,053 03/31/10
24 UniCredit Italy 1,241,967 12/31/10
25 Credit Suisse Group Switzerland 1,098,345 12/31/10
26 Commerzbank Germany 1,007,882 12/31/10
27 Goldman Sachs Group United States 911,332 12/31/10
28 Intesa Sanpaolo Italy 880,221 12/31/10
29 Rabobank Group Netherlands 871,908 12/31/10
30 Norinchukin Bank** Japan 844,431 09/30/10
31 China Development Bank China 771,729 12/31/10
32 Nordea Bank Sweden 776,108 12/31/10
33 Dexia Belgium 757,262 12/31/10
34 Banco Bilbao Vizcaya Argentaria (BBVA) Spain 738,560 12/31/10
35 Royal Bank of Canada (RBC)* Canada 713,646 12/31/10
36 National Australia Bank* Australia 664,174 12/31/10
37 Commonwealth Bank of Australia Australia 660,205 12/31/10
38 Toronto-Dominion Bank (TD) Canada 608,113 12/31/10
39 Westpac Banking Corporation* Australia 598,647 12/31/10
40 Bank of Communications China 596,655 12/31/10
41 KfW Germany 590,269 12/31/10
42 Danske Bank Denmark 572,547 12/31/10
43 Scotiabank (Bank of Nova Scotia) Canada 516,939 12/31/10
44 Standard Chartered United Kingdom 516,542 12/31/10
45 Australia & New Zealand Banking Group (ANZ) Australia 514,857 09/30/10
46 DZ Bank Germany 512,378 12/31/10
47 ABN Amro* Netherlands 509,249 12/31/10
48 Banque Fédérative du Crédit Mutuel (BFCM) France 501,422 12/31/10
49 Landesbank Baden-Württemberg (LBBW) Germany 500,285 12/31/10
50 Banco do Brasil Brazil 481,179 12/31/10

Source: Fitch Ratings except

* Moody’s Investors Service

** Norinchukin Bank

Source: Global Finance

Three of the four U.S. super-banks are in the top ten. With the exception of ICBC, the rest of the top 10 are either European or American banks. None of the banks from Russia and India made it to this list.

Disclosure: Long many banks in the above list

Knowledge is Power: Argentina, Sweden, Housing Madness Edition

What Options Are Left for the Common Currency?

Signs of Desperation: Fee Increases Signal End of an Era for Too Big To Fail Banks

How Argentina left its Eurozone

Should you run from the bear or grin at it?

Mishra: India’s Rising Tide Doesn’t Lift All Rural Boats

Lessons learned from the dotcom bubble

That’s how it worked out for Sweden

American jobless: unemployed and uncounted

How long can the housing madness last?

Bullet Train, Japan


Keep Calm and Buy These 10 Foreign Stocks

The extreme volatility in the equity markets in the past few weeks are making many investors nervous. Some of them are making the wrong moves based on emotions. Yesterday’s Wall Street Journal had an article discussing how some people are liquidating their equity holdings and moving into cash. From the article titled “Tired of Ups and Downs, Investors Say, ‘Let Me Out!‘”:

Leonard Gerber, a 65-year-old financial planner, has seen plenty of volatile markets during his career. But this one feels different.

Last month, the Syracuse, N.Y., resident cashed in his stock funds—and he has no intention of diving back in anytime soon. “I feel like a deer in headlights,” he says.

Across the country, investors are fleeing the stock market for the safety of cash. On Tuesday the Standard & Poor’s 500-stock index lost as much as 2.2% before a late-day rally sent the index up 2.3% for the session. In the 46 trading days since the beginning of August, the S&P 500 has seen 29 swings of 1% or more.

Tuesday is a “perfect example” of why Mr. Gerber has bailed out. “The market is manic,” he says. “There’s no consistency … and there’s a worrisome amount of volatility.”

The wild action is keeping brokerage firms busy. At Scottrade Inc., trading volume increased 36% on Tuesday afternoon from the day before, which was 30% higher than last week’s average. Principal Financial Group saw call-center volume from investors in work-based retirement plans climb 27% between Friday and Monday.

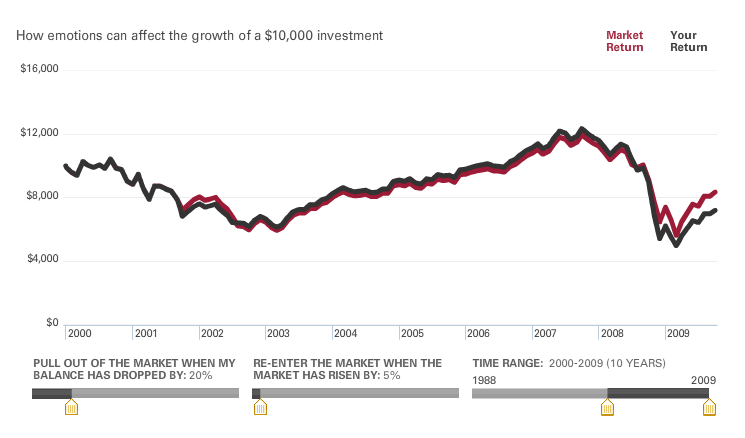
Making investment decisions based on emotions rarely helps investors. As markets are unpredictable, one cannot move in and out of the market without losing gains. This is especially true for retail investors who do not have the time and resources required to analyze market activity on a daily basis.

The following graphs show how returns are negatively impacted with emotional investing:

Scenario #1: Getting out of the market when the account balance has dropped by 20% and re-entering the market when the market has risen by 5%:


Scenario #2: Getting out of the market when the account balance has dropped by 20% and re-entering the market when the market has risen by 15%:

Click to enlarge


Note: The illustration above is a hypothetical example based on total daily returns for the Standard & Poor’s 500 Index for the period noted. It does not account for any investment costs such as commissions, or bid/ask spreads.

Source: The truth about emotion,  The Vanguard Group

Last month many foreign markets entered bear market territory with stocks falling 20% or more. This has created excellent opportunities for long-term investors. Some of the high-quality European stocks are particularly attractive at current levels. Ten such foreign stocks paying dividends of more than 3% are listed below for investors to consider:

1.Company: Empresa Nacional de Electricidad SA (EOC)
Current Dividend Yield: 7.88%
Sector:Electric Utilities
Country: Chile

2.Company: Nestle (NSRGY)
Current Dividend Yield: 3.85%
Sector:Beverages (Nonalcoholic)
Country: Switzerland

3.Company: Tesco plc (TSCDY)
Current Dividend Yield: 4.02%
Sector:Retail (Grocery)
Country: UK

4.Company: Akzo Nobel NV (AKZOY)
Current Dividend Yield: 4.62%
Sector:Chemical Manufacturing
Country: The Netherlands

5.Company: Novartis (NVS)
Current Dividend Yield: 4.26%
Sector:Major Drugs
Country: Switzerland

6.Company: Eni SpA (E)
Current Dividend Yield: 8.30%
Sector:Oil & Gas – Integrated
Country: Italy

7.Company:ABB Ltd (ABB)
Current Dividend Yield: 4.09%
Sector:Electronic Instrumentation & Controls
Country: Switzerland

8.Company:Alumina Ltd (AWC)
Current Dividend Yield: 4.94%
Sector:Metal Mining
Country: Australia

9.Company:TransCanada Corp (TRP)
Current Dividend Yield: 4.16%
Sector:Natural Gas Utilities
Country: Canada

10.Company:Aviva PLC (AV)
Current Dividend Yield: 9.61%
Sector:Insurance (Life)
Country: UK

Disclosure: Long ABB