Euromonitor: Amazon’s Long-Term Outlook Remains Positive, But More Competitive

The Internet retailer Amazon is one of the survivors of the great dot-com bubble of the 1990s. Unlike other retail companies like pets.com that disappeared when the bubble burst, Amazon not only survived but has thrived ever since. As the retail industry is highly competitive and has one of the lowest profits margins, it takes extraordinary effort and resources for a company to be successful. In this perspective, one has to appreciate the skills and perseverance of Mr.Jeff Bezos who started Amazon as a site selling for books back in 1994.

Euromonitor published a report recently on Amazon’s growth and analyzed the company’s future prospects. The following are some of the key takeaways from the report:

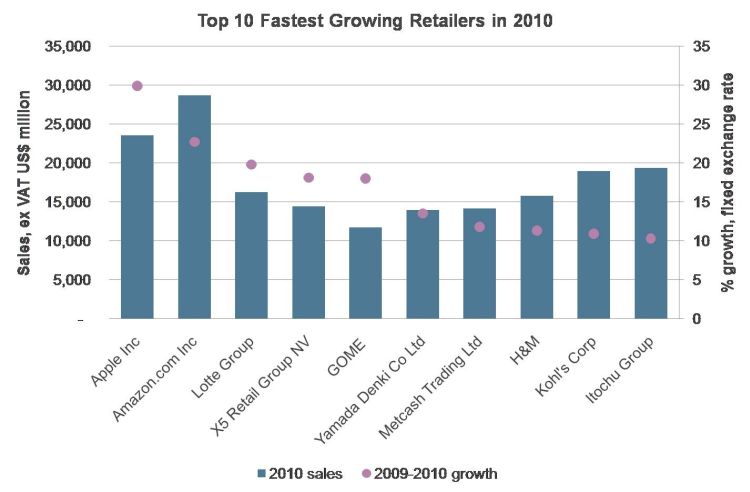
  • After Apple (AAPL), Amazon(AMZN) was the second fastest growing retailer in 2010. The Top 10 fastest growing retailers in the world last year are shown in the chart below:

Click to enlarge

Source: Euromonitor International

  • Amazon benefited strongly as direct competitors such as WalMart(WMT) and Tesco (TSCDY), pure-plays like Netflix (NFLX) and eBay(EBAY) failed to beat Amazon in the online retail business.
  • By acquiring Zappos, Quidsi, BuyVIP, LivingSocial and Lovefilm, Amazon has expanded its product offerings and the introduction of product-specific landing pages is extending the breadth of range.
  • The introduction of a grocery service in Germany and the UK in mid-2010 should benefit growth in those markets as consumers switch to Amazon from traditional high-cost retailers.
  • Amazon Prime, in which consumers pay an upfront fee (US$75 in the US, £49 in the UK) for free shipping and other deals, has been a big hit in the US and the UK creating loyal customers and higher sales per visit.
  • The launch of the Kindle 3 in 2010 made Amazon a competitor to Apple and other players in the e-reader market.
  • Amazon has been innovative with the introduction of high-margin private label products under many lines such as Pinzon (kitchen gadgets), AmazonBasics (electronics accessories), Denali (tools), Pike Street (bath and home products) and Strathwood (outdoor furniture).
  • With the November 2010 launch of a country-specific site for Italy, Amazon’s international operations now include Japan, the UK, France, Germany and China. Amazon plans to expand into the Spanish market this year.

Euronomitor noted that Amazon is taking the right steps to increase sales growth in the future. Increasing product offerings, internationalization, a growing loyal customer base, etc. should help the company in the medium to long term. However in the short to medium term Amazon is likely to face increased competition from other retailers.

Established retail giants like WalMarts and Tesco are refocusing their web sales strategies and plan to invest more to compete against Amazon. But since Amazon’s technology is already much better than the competition, it can continue to stay ahead of the game by further upgrading technology and offering a better experience for customers.

Disclosure: No positions
Benefits of International Diversification Declining

One of the main reasons to invest in foreign stocks is for portfolio diversification. In the past, the correlation U.S. markets and foreign markets were very low which lead to foreign stocks going higher when US stocks went down and vice versa. However in recent decades the benefits due to international diversification are declining.

According to a research study by Vanguard, one reason for the decline in benefits is that individual markets across the world have become more synchronized with the US markets. Accordingly correlations between countries have increased significantly from 0.35 in 1980s to 0.75 as of 2010. Hence investors who invest in non-US stocks for diversification are unable to escape losses when U.S. stocks decline.

This theory is evident in the current performance of global equity markets. For example, the S&P 500 is off 6.4%% YTD. Similarly other developed markets and emerging markets are also down in tandem as shown in the returns of a few sample indices:

  • France – CAC 40: -18.8%
  • UK – FTSE 100 : -13.1%
  • Germany – DAX: -19.9%
  • Brazil – Bovespa: -23.0%
  • China – Shanghai Composite: -7.0%
  • India – Bombay Sensex : -22.7%
  • Chile – Santiago IPSA: -16.4%

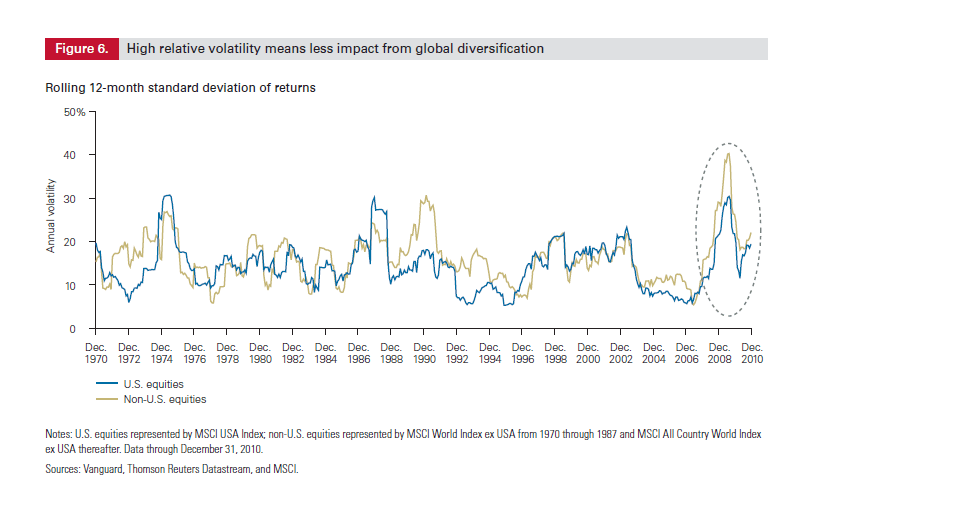
Another reason for the decline in diversification benefits is the spike in volatility in non-US stocks since 2007. The chart below shows the trailing 12-month standard deviation of returns for both U.S. and non-U.S. stocks:

Click to enlarge

Source: Consideration for investing in non-U.S. equities, Vanguard

The spike in volatility has increased the long-term average volatility of non-US markets by one full percentage point from 16.47% to 17.53%.

Hence the higher volatility combined with rising correlation between countries have attriuted to the reduction in international diversification benefits.

Related ETFs:

iShares MSCI Emerging Markets Indx (EEM)
Vanguard Emerging Markets ETF (VWO)
SPDR S&P 500 ETF (SPY)
SPDR STOXX Europe 50 ETF (FEU)
iShares MSCI Brazil Index (EWZ)
iShares FTSE/Xinhua China 25 Index Fund (FXI)
iShares MSCI Germany Index Fund (EWG)

Disclosure: No positions

Top 12 Banks in Insurance Brokerage Fee Income

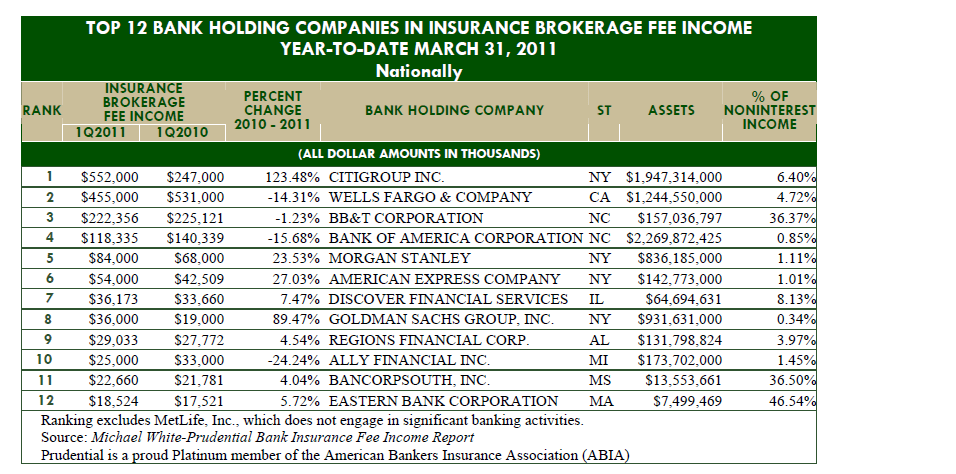
One of the key figures to review in earnings reported by banks is the fee income. Unlike other types of incomes, income from various types of fees are somewhat predictable and stable. Many U.S. banks in recent decades have ventured into the insurance business and their insurance subsidiaries generate sizable revenues. In the first quarter of this year, banks earned the highest quarterly broker fee income of $3.98 billion according to  the Michael White-Prudential Bank Fee Income Report.

The table below shows the top 12 banks in insurance brokerage fee income thru the first quarter of 2011:

Click to enlarge

Source: Michael White Associates

Excluding life insurer MetLife, Citigroup Inc. (C) topped the ranking with insurance brokerage earnings of $552.0 million followed by Wells Fargo & Company (WFC) and BB&T Corporation (BBT).

Other winners:

Assets between $1 billion and $10 billion

Eastern Bank Corporation (MA), Stifel Financial Corp. (M0), Old National Bancorp (IN), Johnson Financial Group, Inc. (WI), and Trustmark Corporation (MS).

Assets between $500 million and $1 billion

Two Rivers Financial Group (IA), 473 Broadway Holding Corporation (NY), Evans Bancorp (NY), Texas Independent Bancshares (TX), and Northeast Bancorp (ME).

Assets under $500 million

Soy Capital Bank and Trust Company (IL), Industry State Bank (TX), Hoosac Bank (MA), First State Bank (IA), and Stoneham Savings Bank (MA).

Disclosure: Long BBT

The World’s 50 Safest Banks 2011

The Global Finance magazine recently announced its annual ranking of the World’s 50 Safest Banks for 2011. These top banks were selected based on an evaluation of long-term credit ratings—from Moody’s, Standard & Poor’s and Fitch—and total assets of the 500 largest banks worldwide.

From the magazine report:

The sovereign debt crisis is still raging in Europe and renewed fears of contagion from southern European countries is affecting banking and market outlooks throughout Europe.Global political instability is also in the spotlight—from the upheavals in the Middle East and Africa to the US debt downgrade by Standard & Poor’s, companies are watching closely to see how these events are affecting their counterparties.

With more than 40 of the top 50 banks from last year once again making the list, the Global Finance ranking shows that most of the top echelon of banks are truly worthy of the moniker World’s Safest Bank.

The table below lists the World’s 50 Safest Banks for this year together with the ticker if available:

[TABLE=1036]

Source: Global Finance

Some observations:

  • The five largest Canadian banks and Montreal-based Caisse centrale Desjardins have made it to this list.
  • Among the U.S. banks, Bank of America (BAC) and Citigroup (C) did not make the cut.
  • Denver-Colorado based CoBank is a $66 billion cooperative bank serving industries across rural America.
  • Despite fears of banking failures in Europe, the majority of the banks in this ranking are European banks.

Disclosure: Long USB, BNS, BMO, RY, TD, SCGLY, STD, BBVA

The 10 Most Actively Traded ADRs by Value

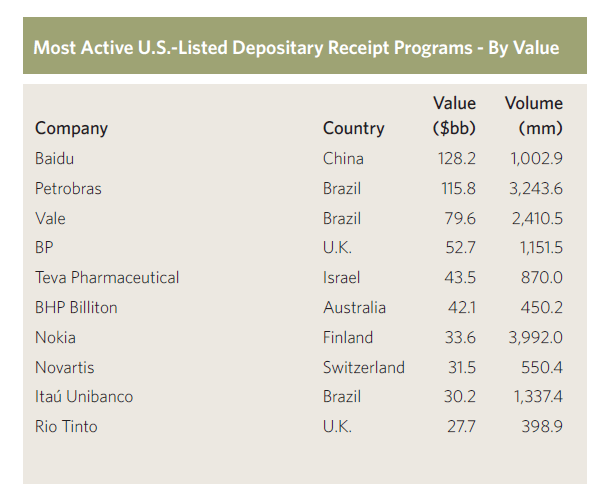
Volatile equity markets and divergent economic growth between the developed and emerging markets have driven trading in Global and American Depository Receipts to new records, according to a mid-year review report by BNY Mellon Depository Receipts. During the first half of this year, 80.5 billion DRs valued at an all-time high of $1.91 trillion, traded hands. The universe of DR programs available to investors has also expanded to 3,364 programs from 77 countries. NASDAQ and the NYSE remain the largest markets for DR trading.

The 10 most actively-traded DRs by value are listed below:

Click to enlarge

China’s Baidu(BIDU) tops the ranking followed by Brazil’s Petrobras(PBR), Vale(VALE), UK’s BP Plc (BP) and Israel’s Teva Pharmaceuticals (TEVA).

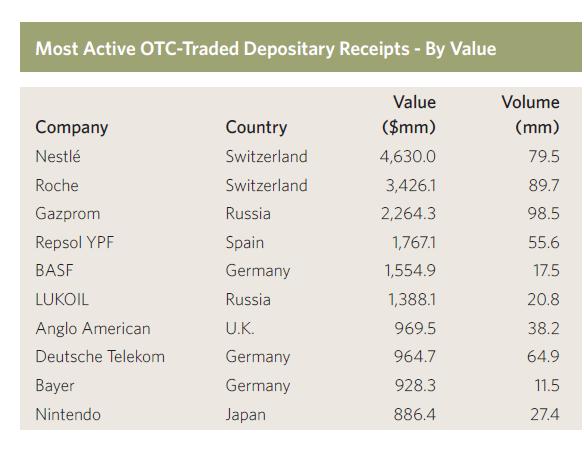
The 10 most active OTC-traded DRs by value are listed below:

Click to enlarge

Source: The Depositary Receipt Markets, 2011 Mid-Year Review, BNY Mellon

Despite the ongoing firestorm in the European equity markets, Switzerland-based Nestle SA(NSRGY) is holding up very well. The stock closed at $61.71 today relative to its 52-week high of $65.53. The other top four actively-traded ADRs include Roche (RHHBY), Gazprom(OGZPY), Repsol (REPYY) and German chemical giant BASF (BASFY).

Disclosure: Long ITUB, PBR