Commodity Bear Markets Since 1975

Commodities have become an attractive asset class to ordinary investors in the past few years. Heavy marketing by Wall Street firms and the dismal economic situation have made investors turn to commodities for higher returns. However unlike other assets, commodities are extremely volatile, unpredictable and are affected by a multitude of factors that are difficult to evaluate. For example, while it easy for an ordinary investor to bet on Wheat, Corn or Crude Oil understanding the dynamics of those markets such as the concept of Contango are not easy.Similar problem exists with other commodities such as metals like steel and precious metals like Gold, Silver, Platinum, etc.

Before jumping into commodities investors have to understand the risks involved and realize that commodity prices can move violently up or down within a short period of time.

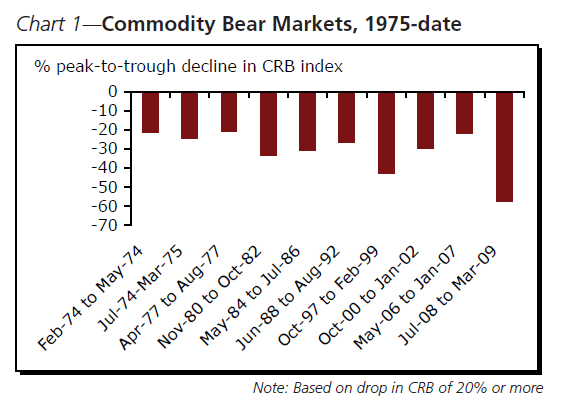
The following chart shows the bear markets in commodities since 1975:
Source: Commodities: Canaries in the Global Economic Mineshaft, CIBC Commodities Update

From the CIBC report:

There have been 10 bear resource markets in the last 35 years, lasting about 16 months on average. Including 2008-09’s particularly savage retreat, those episodes have seen prices drop by about 30% on average, on a peak-to-trough basis, half again the scale of the recent pullback.

Some related ETFs:

ProShares Ultra Oil & Gas (DIG)
United States Natural Gas Fund LP (UNG)
iShares Silver Trust (SLV)
The Teucrium Corn ETF (CORN)

Disclosure: No Positions
Why The West Needs China More Than The Other Way Around

The European Union has sought China for help with solving the current debt crisis. The Europeans are asking the Chinese to invest in a fund setup as part of the European Financial Stability Facility (EFSF) program. Negotiations are underway between the two parties as the Chinese are keen to take advantage of the opportunity but want to make sure that they are getting a better deal on their investments.

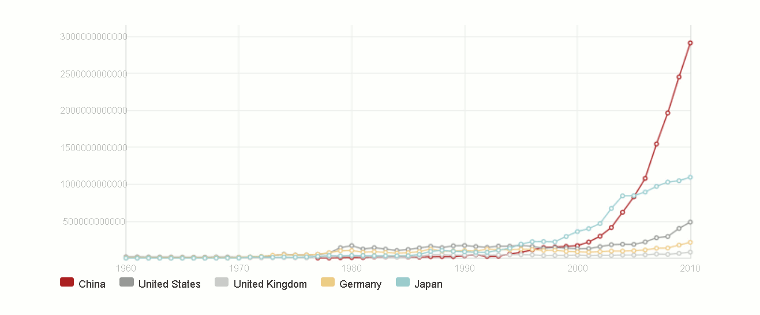
The following graphic shows why China is in a better position to lend compared with select developed countries:

Click to enlarge

Note: Please excuse the quality of the chart.

Source: Chart of the Day: why Europe really, really needs China,  CityWire, UK

It is not just the EU that is currently dependent on China to solve fiscal issues. As the world’s largest debtor nation, the U.S. also depends heavily on China to sell its debt. China remains the largest foreign holder of U.S. debt with total holdings exceeding $1.2 Trillion.

The economies of the developed world remain in contraction mode now and are projected to under-perform emerging economies over the next few years. Hence debt crises and other issues can occur again in the developed world. As a result it is safe to say that the West needs China more than China needs the West.

A Look at Gold Prices from 1800 To 2011 and 10-Year Returns

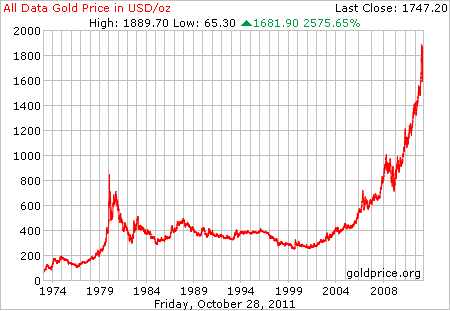
The price of Gold has soared in recent years and reached record highs earlier this year. In the past few months the price has stabilized slightly. On Friday (10/28/11) the spot price for gold closed at $1,743.40 according to Kitco. In the past 20 years, gold has returned an incredible 2,575% as shown in the chart below:

Click to enlarge


Source: www.goldprice.org

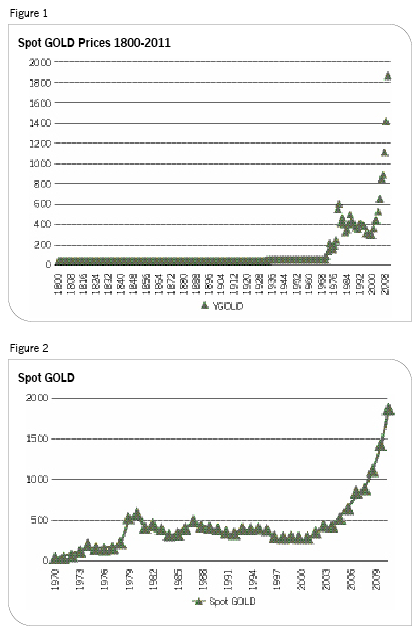
Despite the dramatic rise of prices in recent years, for much of the recorded history gold prices languished. For the period from 1800 to 1933 gold prices remained flat at around $20 per troy ounce according to an article titled Gold-The Fear Index by Somnath Basu in the Financial Advisor magazine.

The following charts show the long-term historical prices of gold:

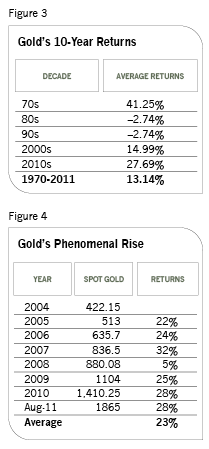
Somnathu notes that it was only after the Bretton Woods agreement was dismantled in 1967 and globalization began, the traditional global economic order collapsed and the precious metal started its first phase of growth. The following chart shows Gold’s 10-year returns and annual returns for the past few years:

Source: Gold – The Fear Index, Financial Advisor magazine

From the article:

Gold is a mirror. Its price gauges global economic fear. Fear of uncertainty, fear of losses and fear of poverty. As long as this fear remains in this world, the new gold standard will continue to reflect the fear standard. The index of fear!

The author concludes that “As long as global markets remain volatile and investor fears grow, gold will continue to increase in price.” I agree with the author’s conclusion. However it must be noted that investing in gold is not a bullet-proof strategy especially for long-term investors and income-seeking investors such as retirees. This is because gold does not pay any income such as dividends paid by equities or interest paid by bonds and the metal’s price is determined purely based on speculation. For example, the demand for gold continues to remain strong in India – the world’s largest gold consuming country, China, etc. But that does not mean the demand will not dimish at higher prices unless income rises at the current pace in those countries. So if the demand decreases global gold prices will fall. Hence investors should only allocate a small portion of their portfolio assets to gold and the majority of assets should still be invested in stocks and bonds.

Related ETF:

SPDR Gold Shares ETF (GLD)

Disclosure: No Positions

Canada Outperforms Other Developed Markets

Fidelity Invesments’ Viewpoints recently published an interview with Doug Lober, manager of Fidelity Canada Fund (FICDX). In the interview Doug discusses the strong performance of the Canadian equity market relative to other developed markets and some of the opportunities that await investors north of the border.

From the article titled Canada: Land of opportunity?:

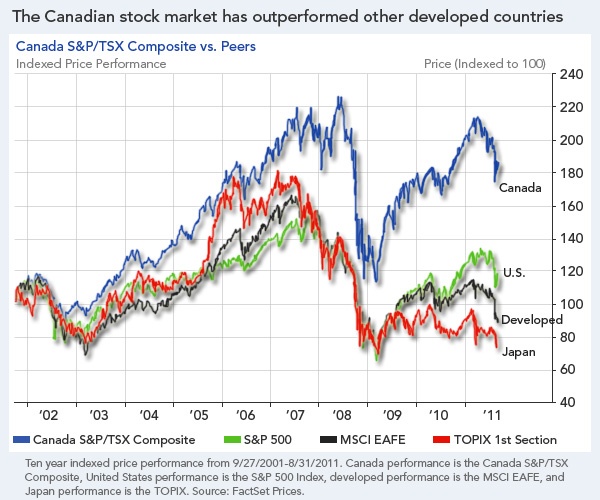
Developed countries have found themselves in the economic doghouse of late, saddled with debt, financial crises, and stock markets that have produced middling returns with maddening volatility. A striking exception has been Canada, where stocks have risen an average 13% a year over the last 10 years. A hypothetical $1,000 investment in the S&P/TSX Composite Index, an index of the stock prices of the largest companies on the Toronto Stock Exchange (TSX), on August 1, 2001, would have been worth $3,455 on August 31, 2011–versus only $1,305 had you invested it in the S&P 500® Index (SPX) during that same period.

The following graphic shows the 10-year return of the Canadian market vs. other developed markets:

Click to enlarge

Source: Fidelity Viewpoints

Note: The returns noted above are in US dollars.

Doug noted that about two-thirds of the Canadian returns has come from stock market gains with the other one-third from appreciation in the Canadian dollar.

Investors looking to gain exposure to the Canadian market have a wide range of companies to choose from that trade on the U.S. markets. As the country is primarily a commodity-based economy, energy and mining stocks dominate the domestic equity market. However investors can find many companies in the banking, healthcare, utility and other sectors that are stable and earn decent returns year after year.

The following is a list of ten Canadian companies currently having attractive dividend yields:

1.Company: Manulife Financial Corp (MFC)
Current Dividend Yield: 3.82%
Sector: Life Insurance

2.Company: Bank of Nova Scotia (BNS)
Current Dividend Yield: 3.71%
Sector: Banking

3.Company: Royal Bank of Canada (RY)
Current Dividend Yield: 4.31%
Sector: Banking

4.Company: Toronto Dominion Bank (TD)
Current Dividend Yield: 3.37%
Sector: Banking

5.Company: Rogers Communications Inc (RCI)
Current Dividend Yield: 3.92%
Sector: Telecom

6.Company: Shaw Communications Inc (SJR)
Current Dividend Yield: 4.61%
Sector: Broadcasting & Cable TV

7.Company: Enbridge Inc (ENB)
Current Dividend Yield: 2.86%
Sector: Natural Gas utilities

8.Company: Sun Life Financial Inc (SLF)
Current Dividend Yield: 5.73%
Sector: Life Insurance

9.Company: TransCanada Corp (TRP)
Current Dividend Yield: 3.72%
Sector: Natural Gas utilities

10.Company: Telus Corp (TU)
Current Dividend Yield: 4.39%
Sector: Telecom

Note: Dividend yields mentioned above are as of market close October 28, 2011

Disclosure: Long TD, RY and BNS

Bank of Ireland ADR Reverse Split

Bank of Ireland (IRE) effected a 1:10 reverse stock split on its ADR effective October 14, 2011.

The ADR closed at $0.83 on Friday, October 14th. The stock will start trading at the reverse split price of $8.30 on Monday, Oct 17th.

From Bank of Ireland Investor Relations site:

The current ratio for Bank of Ireland is 1:4 (ADR: Ordinary Share).

The Bank is implementing a change in the ratio of ADRs to ordinary shares. Effective 14 October the current ratio of one (1) ADR representing four (4) ordinary shares will change. The new ratio will be one (1) ADR representing forty (40) ordinary shares. As a result a mandatory reverse split has been effected on the basis of one (1) new ADR for every ten (10) old ADRs.

Unlike Allied Irish Bank, Bank of Ireland did not get nationalized but still crashed heavily and had to go thru a reverse stock split.

After closing at $0.83 on Oct 16th, the stock opened at $7.00 on heavy volume instead of the expected $8.30 as a result of the reverse split. Yesterday it closed at $6.24. Reverse splits usually don’t work as it clear from the stock price action since the reverse split. Hence it is better to avoid Bank of Ireland at current levels.

Disclosure: No positions