12 Canadian Blue Chips To Consider For Income

The S&P 500 is flat year-to-date as of December 5th. The performance of the S&P/TSX Composite Index of Canada has been worse with a loss of 9.8% YTD.However it must be noted that Canadian equities have performed better than US stocks in the long run.

The yield on the S&P 500 stands at about 2.15%. Investors looking to earn higher yields can consider many of the well-run companies north of the border. Stocks in the utility and banking sectors pay solid dividends with consistent dividend growth and have the potential for capital appreciation as well.

The current yield on the 10 year Government of Canada bond bond is about 2%. Over the past sixty years, the yield on the S&P/TSX Composite Index has been a little less than half of the government bond yield.  The dividend yield of the composite index was at about 2.8% recently which is much higher than the historical yields. Hence this is one compelling reason for investors to invest in high quality Canadian dividend stocks.

In a recently article in The Globe and Mail, author Bob Carrick notes that according to the firm Baskin Financial Service, the 2.8% dividend yield on the S&P/TSX Composite Index is also the second-highest in the past 20 years.

Twelve highest-yielding Canadian blue chips are listed below together with their tickers on the US market and the current dividend yield:

[TABLE=1051]

Source: A clear-cut case for buying stocks, The Globe and Mail

Disclosure: Long all five banks noted above.
Stock Trading Volume in U.S. Remains High

I wrote an article last year discussing about the fall in stock holding periods globally. In this post lets take a review how equity and option trading volumes in the U.S. have soared over the years.

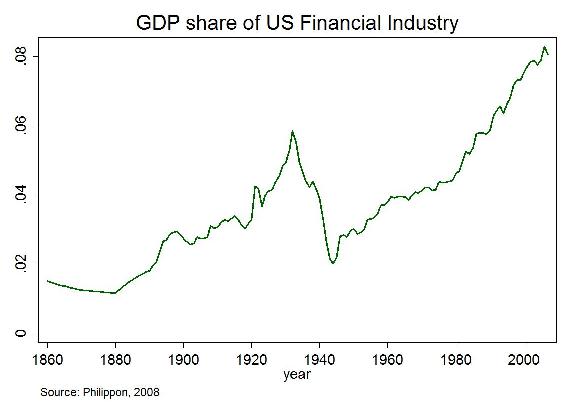
The financial services industry is one of the major components of the US economy. While in the past manufacturing and other goods producing industries used to the main drivers of the US economy, in the past few decades they were replaced by the FIRE (Financial Services, Insurance and Real Estate) sector.

The following chart shows the growth of the US financial services industry as a percentage of the GDP:

Click to enlarge

Source: The future of the financial industry – Thomas Philippon, Stern on Finance

The financial industry was about 1.5% of GDP in the mid-19th century. From under 2% in 1940s it steadily climbed to reach about 8.3% of the GDP in  2006. And it has continued to remain high since 2006.

In spite of dominating the US economy, the financial industry is one of the most inefficient industries.The main role of the financial industry is to facilitate intermediation of money in the economy. However technological advancements including the IT revolution have not made the industry efficient according to an article by Professor Thomas Philippon of NYU’s Stern School of Business. From the article:

Based on what we see in wholesale and retail trade, IT should have made finance smaller, not larger. What happened? Why did we get the bloated finance industry of today instead of the lean and efficient Wal-Mart? Finance has obviously benefited from the IT revolution and this has certainly lowered the cost of retail finance. Yet, even accounting for all the financial assets created in the US, the cost of intermediation appears to have increased. So why is the non-financial sector transferring so much income to the financial sector?

One simple answer is that technological improvements in finance have mostly been used to increase secondary market activities, i.e., trading.

Click to enlarge

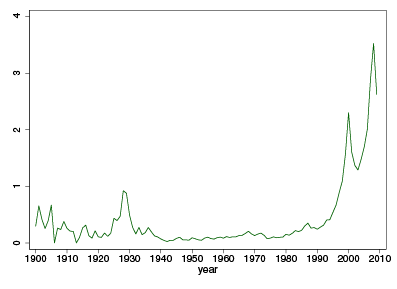
Equity Trading Volume over GDP

Figure 5 shows the dollar volume of equity trading over GDP in the US. The finance industry of 1900 was just as able as the finance industry of 2000 to produce bonds and stocks, and it was certainly doing it more cheaply. But the recent levels of trading activities are at least three times larger than at any time in previous history. Trading costs have decreased (Hasbrouck 2009), but the costs of active fund management are large. French (2008) estimates that investors spend 0.67% of asset value trying (in vain, by definition) to beat the market.

Source: Has the finance industry become less efficient? Or Where is Wal-Mart when we need it?, VoxEU

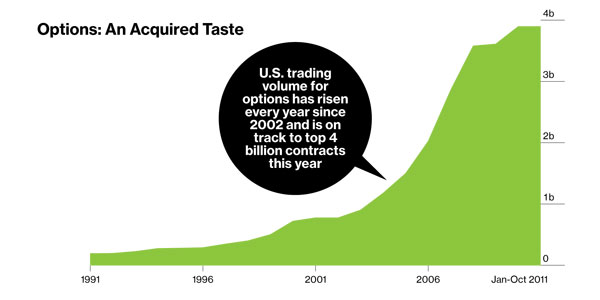
One of the effects of the astronomical increase in trading volume is that stock holding periods have decreased significantly. In addition, volatility has increased with High-Frequency Trading (HFT) and other activities worsening the situation. Trading volumes for options has also increased in the past few years according to a report in Bloomberg BusinessWeek: Source: Online Brokers Court Option Traders, Bloomberg BusinessWeek

In summary, though the cost of trading stocks and other instruments have become extremely cheap it does not necessarily mean investors are reaping the benefits of growth in technology. In my opinion, the opposite is true. Easier and cheaper trading has turned many investors into short-term traders instead of long-term investors.

Tier 1 Core Capital Ratio of Select Developed Market Banks

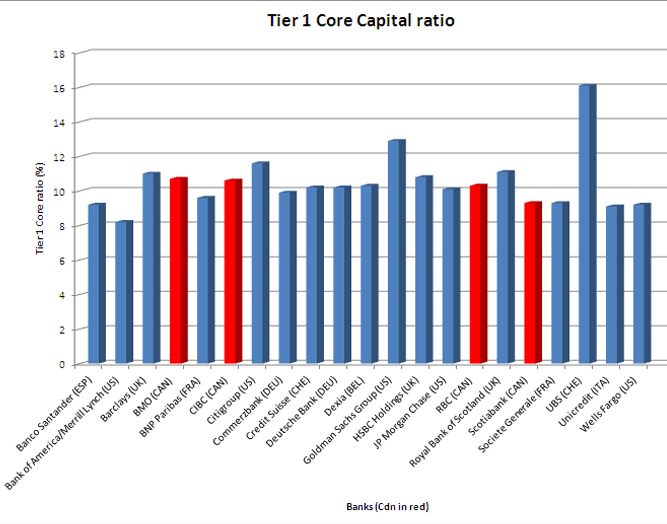
Tier 1 Core Capital is used by regulators to determine the strength of a bank. The higher the ratio the better the position of a bank. The following chart shows the Tier 1 Core Capital Ratio of select large-cap western banks:

Click to enlarge

Note: Data used are based on Q2 2011 reports.

Source: How strong are Western Banks, Canadian Business

From the Canadian Business article:

Tier 1 core capital (or common equity as it is formally called by the Bank for International Settlements) measures a bank’s equity position relative to its assets. It essentially asks, how strong is the foundation on which the bank’s wealth is built? Eligible capital includes common equity and declared reserves, minus certain classes of preferred shares, goodwill and hybrid capital. This is then divided by the total for risk-weighted assets. Because of the deductions it’s considered a finer measure of financial strength than the Tier 1 capital ratio.

Tier 1 Core Capital Ratio definition from Wikipedia:

In the Basel II accord bank capital has been divided into two “tiers” each with some subdivisions.

Tier 1 capital, the more important of the two, consists largely of shareholders’ equity and disclosed reserves. This is the amount paid up to originally purchase the stock (or shares) of the Bank (not the amount those shares are currently trading for on the stock exchange), retained profits subtracting accumulated losses, and other qualifiable Tier 1 capital securities (see below). In simple terms, if the original stockholders contributed $100 to buy their stock and the Bank has made $10 in retained earnings each year since, paid out no dividends, had no other forms of capital and made no losses, after 10 years the Bank’s tier one capital would be $200. Shareholders equity and retained earnings are now commonly referred to as “Core” Tier 1 capital, whereas Tier 1 is core Tier 1 together with other qualifying Tier 1 capital securities.

Canadian banking giant TD Bank(TD) is not included in the above chart since it does not report this ratio. Relative to banks in other developed countries, US banks are much stronger now based on the Tier 1 Core Capital Ratio as they have shored up their capital positions after the financial crisis of 2008. However billions of bad loans especially tied to the real estate sector have still not be written off their books and the suspension of mark-to-market valuation method may have also inflated their asset values. So though US banks appear strong, from an investment point of view an investor has to be extremely selective due to the difficulties in evaluating their true earnings.

Disclosure: Long many banks listed above

The Role of Bonds in a Stock Portfolio


Bonds should be an integral part of a well diversified portfolio.While stocks in general stocks offer higher growth than bonds, investors should not ignore the value of holding bonds as an asset class.

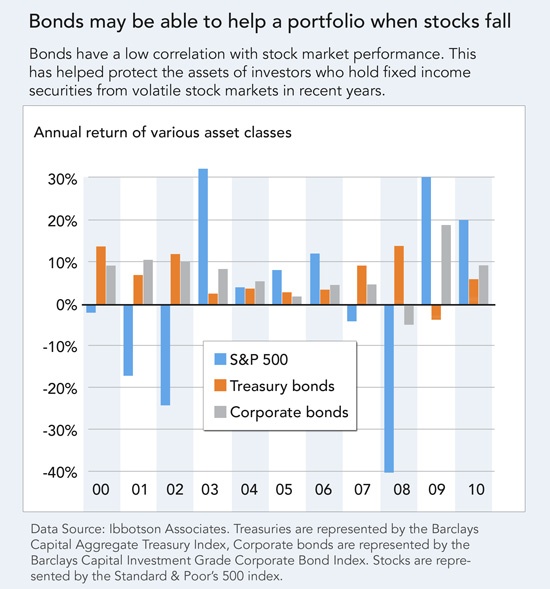
For the period from 2000 to 2010, the S&P 500 was basically flat leading many to call it as the “lost decade” for U.S. stocks. However a research report Fidelity Investments notes that during the same period “Treasury bonds gained 6.25% annually and corporate bonds gained 6.96% annually, respectively.1 And if the economy continues to limp along, bonds could continue to outperform stocks.”

Note:

1. Returns represent the average annual return of indexes from December 31, 1999 to December 31, 2010, as measured by the Barclays Capital Aggregate Treasury Index and the Barclays Capital Aggregate Investment Grade Corporate Bond Index, respectively.

Bonds offer the following benefits to a portfolio:

  • Lower volatility
  • Diversification
  • Fax efficiency

The following chart shows the performance of stocks and bonds from 2000 to 2010:

Click to enlarge

Source: Bonds for growth investors, Fidelity Investments

Hence investors should allocate some portion of their assets to fixed income. The exact percentage of allocation depends on the individual. For example, young investors may want to allocate only a smaller pecentage to bonds compared to older investors who should have the majority of their assets in bonds and other less risky investments. Regardless of age and other factors, investors should hold bonds at all times. Holding bonds in a portfolio is especially important in the current scenario where equity markets have become extremely volatile.

Related ETFs:

SPDR S&P 500 ETF (SPY)
iShares Barclays Treasury Inflation Protected Securities Fund (TIP)
iShares iBoxx $ Investment Grade Corporate Bond Fund (LQD)
iShares Barclays US Aggregate Bond Fund(AGG)
Vanguard Total Bond Market ETF (BND)
PIMCO Enhanced Short Maturity Strategy Fund (MINT)

Disclosure: No Positions

11 Foreign Large Caps Paying More Than 5% Dividends

With one month to go in this year, I wanted to identify some foreign large cap ADRs that paid dividends of over 5%. So I ran the stock screener with the following criteria:

1. Stocks must trade on the NYSE
2. Market capitalization must be >= $50B
3. Stocks must have dividend yields of 5% or more

The search resulted in the following 11 stocks:

1.Company: Vodafone Group Plc (VOD)
Current Dividend Yield: 5.57%
Sector: Telecom
Country: UK

2.Company: Royal Dutch Shell plc (RDS.A)
Current Dividend Yield: 5.03%
Sector: Integrated Oil & Gas
Country: UK

3.Company: TOTAL S.A. (TOT)
Current Dividend Yield: 6.53%
Sector: Integrated Oil & Gas
Country: France

4.Company: GlaxoSmithKline plc(GSK)
Current Dividend Yield: 5.15%
Sector: Major Drugs
Country: UK

5.Company: Sanofi SA (SNY)
Current Dividend Yield: 5.24%
Sector: Major Drugs
Country: France

6.Company: Telefonica S.A (TEF)
Current Dividend Yield: 11.88%
Sector: Telecom
Country: Spain

7.Company: Eni S.p.A. (E)
Current Dividend Yield: 6.98%
Sector: Integrated Oil & Gas
Country: Italy

8.Company: Vale (VALE)
Current Dividend Yield: 7.92%
Sector: Metal Mining
Country: Brazil

9.Company: Westpac Banking Corporation (WBK)
Current Dividend Yield: 8.05%
Sector: Banking
Country: Australia

10.Company: Banco Santander, S.A. (SAN)
Current Dividend Yield: 2.13%
Sector: Banking
Country: Spain

11.Company: AstraZeneca PLC (AZN)
Current Dividend Yield: 6.06%
Sector: Biotechnology & Drugs
Country: UK

Disclosure: Long STD