Why Asian Bank Stocks Are Worth A Look

Asian banks for the most part remained relatively unscathed during the Global Financial Crisis of 2008. However that situation appears to be changing. According to a recent report in The Wall Street Journal, “Despite relatively strong economic growth, risks for banks are growing in Asia. Among the risks are a big increase in lending in recent years, rising individual debt levels in the region, headwinds from the European debt crisis and a slowdown in China.”
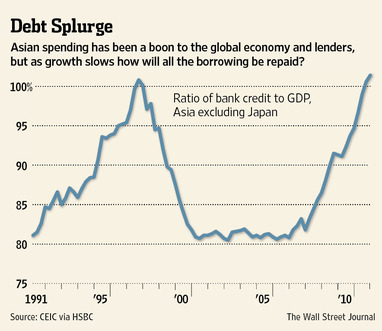
Source: Warning Signs Rise for Big Lenders in Asia, The Wall Street Journal

The article also noted:

To be sure, Asian banks are adequately capitalized, economic growth remains faster than in the U.S. and Europe, and nonperforming loans are rising from very low levels.

Nonperforming loan ratios are 73% below their long-term average in Asia, with some countries at 1% or lower, according to brokerage CLSA Asia Pacific Markets. CLSA has said it expects nonperforming loans to turn sharply higher this year.

U.S. banks are now stronger than European banks. However Asian banks are in a much better position than both U.S. and European banks. Banks in Asia are highly regulated and follow conservative business practices with very limited exposure to derivatives and high-risk lending. Hence U.S. investors looking to invest in foreign bank stocks can consider some of the Asian banks shown below:

[TABLE=1059]

Singapore’s DBS Bank (DBSDY) and United Overseas Bank (UOVEY) appear on the World’s 50 Safest Banks ranking by Global Finance magazine and also in the Bloomberg Markets’ latest annual ranking of the world’s strongest banks.

Disclosure: No Positions
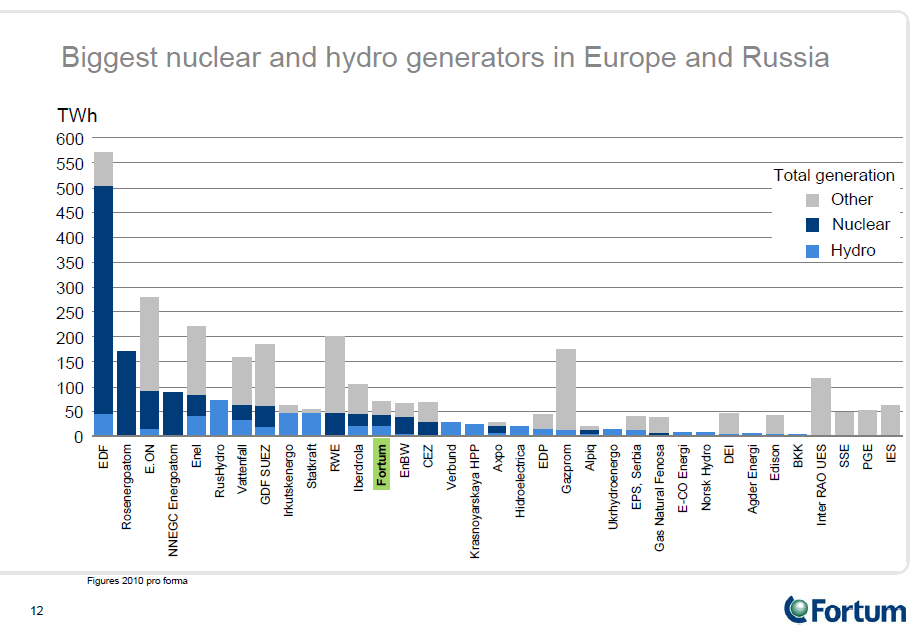
The Biggest Nuclear and Hydro Power Generators in Europe and Russia

The STOXX® Europe 600 Utilities index is down over 3% YTD (in terms of price in Euros) and is off about 22% in the past 52 weeks. In the past five years the index is down about 50%.  Comprising of 27 of the largest utilities in Europe, the performance of the index in the 5-year period shows how much the traditionally safe sector has plunged in line with the equity markets of Europe. Despite the erosion of investors’ interest in European utility stocks, long-term investors looking for decent dividends and stable growth can consider adding some of them at current levels.

The following chart shows the Biggest Nuclear and Hydro Power Generators in Europe and Russia:

Click to enlarge

Source: Fortum, Investor/Analyst Material, May 2012

Some of the above utilities that trade on the US markets are listed below with their current dividend yields:

1.Company:Electricite de France SA (ECIFY)
Current Price: $4.18
Current Dividend Yield: 7.19%
Country: France

2.Company:E.ON AG (EONGY)
Current Price: $20.76
Current Dividend Yield: 6.29%
Country: Germany

3.Company: Enel (ENLAY)
Current Price: $3.10
Current Dividend Yield: 16.75%
Country: Italy

4.Company: GDF Suez (GDFZY)
Current Price: $22.42
Current Dividend Yield: 9.14%
Country: France

5.Company: RWE AG (RWEOY)
Current Price: $42.16
Current Dividend Yield: 6.25%
Country: Germany

6.Company: Iberdrola SA (IBDRY)
Current Price: $18.17
Current Dividend Yield: N/A
Country: Spain

7.Company: Fortum (FOJCY)
Current Price: $4.17
Current Dividend Yield: 6.31%
Country: Finland

8.Company: Verbund AG (OEZVY)
Current Price: $5.36
Current Dividend Yield: 2.69%
Country: Austria

9.Company: EDP Energias de Portugal SA (EDPFY)
Current Price: $28.62
Current Dividend Yield: 8.46%
Country: Portugal

10.Company: Gas Natural (GASNY)
Current Price: $2.90
Current Dividend Yield: 6.32%
Country: Spain

11.Company: Norsk Hydro AS (NHYDY)
Current Price: $4.54
Current Dividend Yield: 2.96%
Country: Norway

Note: All prices and dividends are as of May 4, 2012

Disclosure: Long EONGY, FOJCY, RWEOY

Download: Barclays Equity Gilt Study 2011

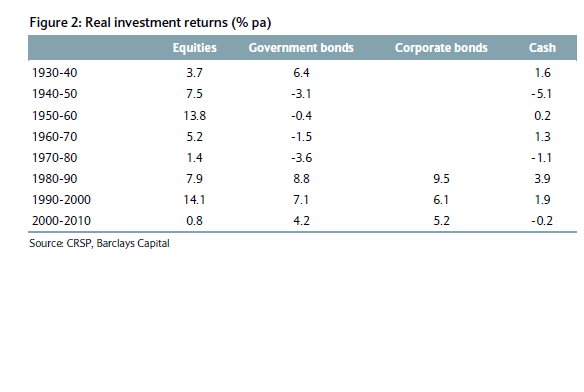
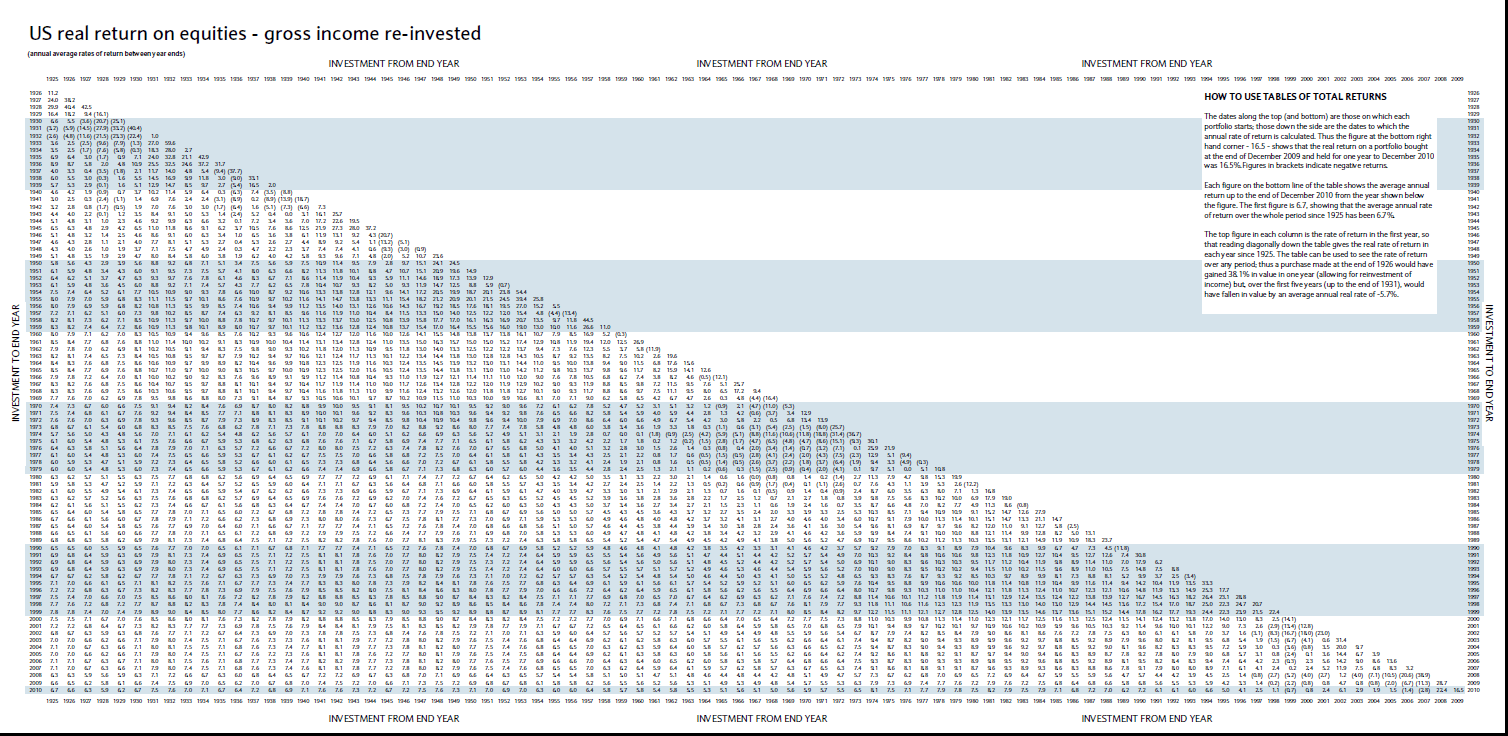
Barclays publishes the Equity Gilt Study each year. The 56th edition was published last year. This report provides useful insights on the performance of US and UK equities, bonds and other assets.  In addition, the report contains data on emerging markets, investment strategies and other related information.

The following are few of the interesting charts related to US stocks found in the Barclays Equity Gilt Study of 2011:

Click to enlarge

a. Real Investment Returns of Asset types by Decades

b. Comparison of Returns with and without Reinvestment of Income


c. US Real Return on Equities with Gross Income Re-invested

Download: Barclays Equity Gilt Study 2011 (full version in pdf)

The World’s Largest Power Markets

The following chart shows the world’s largest markets for electricity:

Click to enlarge

The U.S. and China consume more than four times the power consumed by the next largest market of Japan. With has a population of about 1.1 billion India’s power generation capacity is much lower than that of China. Though Russia has a small population it produces more electricity than India.

Source: Fortum, Investor/Analyst Material, March 2012

Disclosure: Long Fortum