The Top Luxury Companies in the World by Revenue in 2021 is shown in the chart below. France-based LVMH is in a league of its own in the luxury sector. The company generated about $76.0B last year. With scores of brands like Dior, Tiffany, etc. in various categories ranging from fashion to wine and everything in between, LVMH’s breadth is incredible.
Click to enlarge
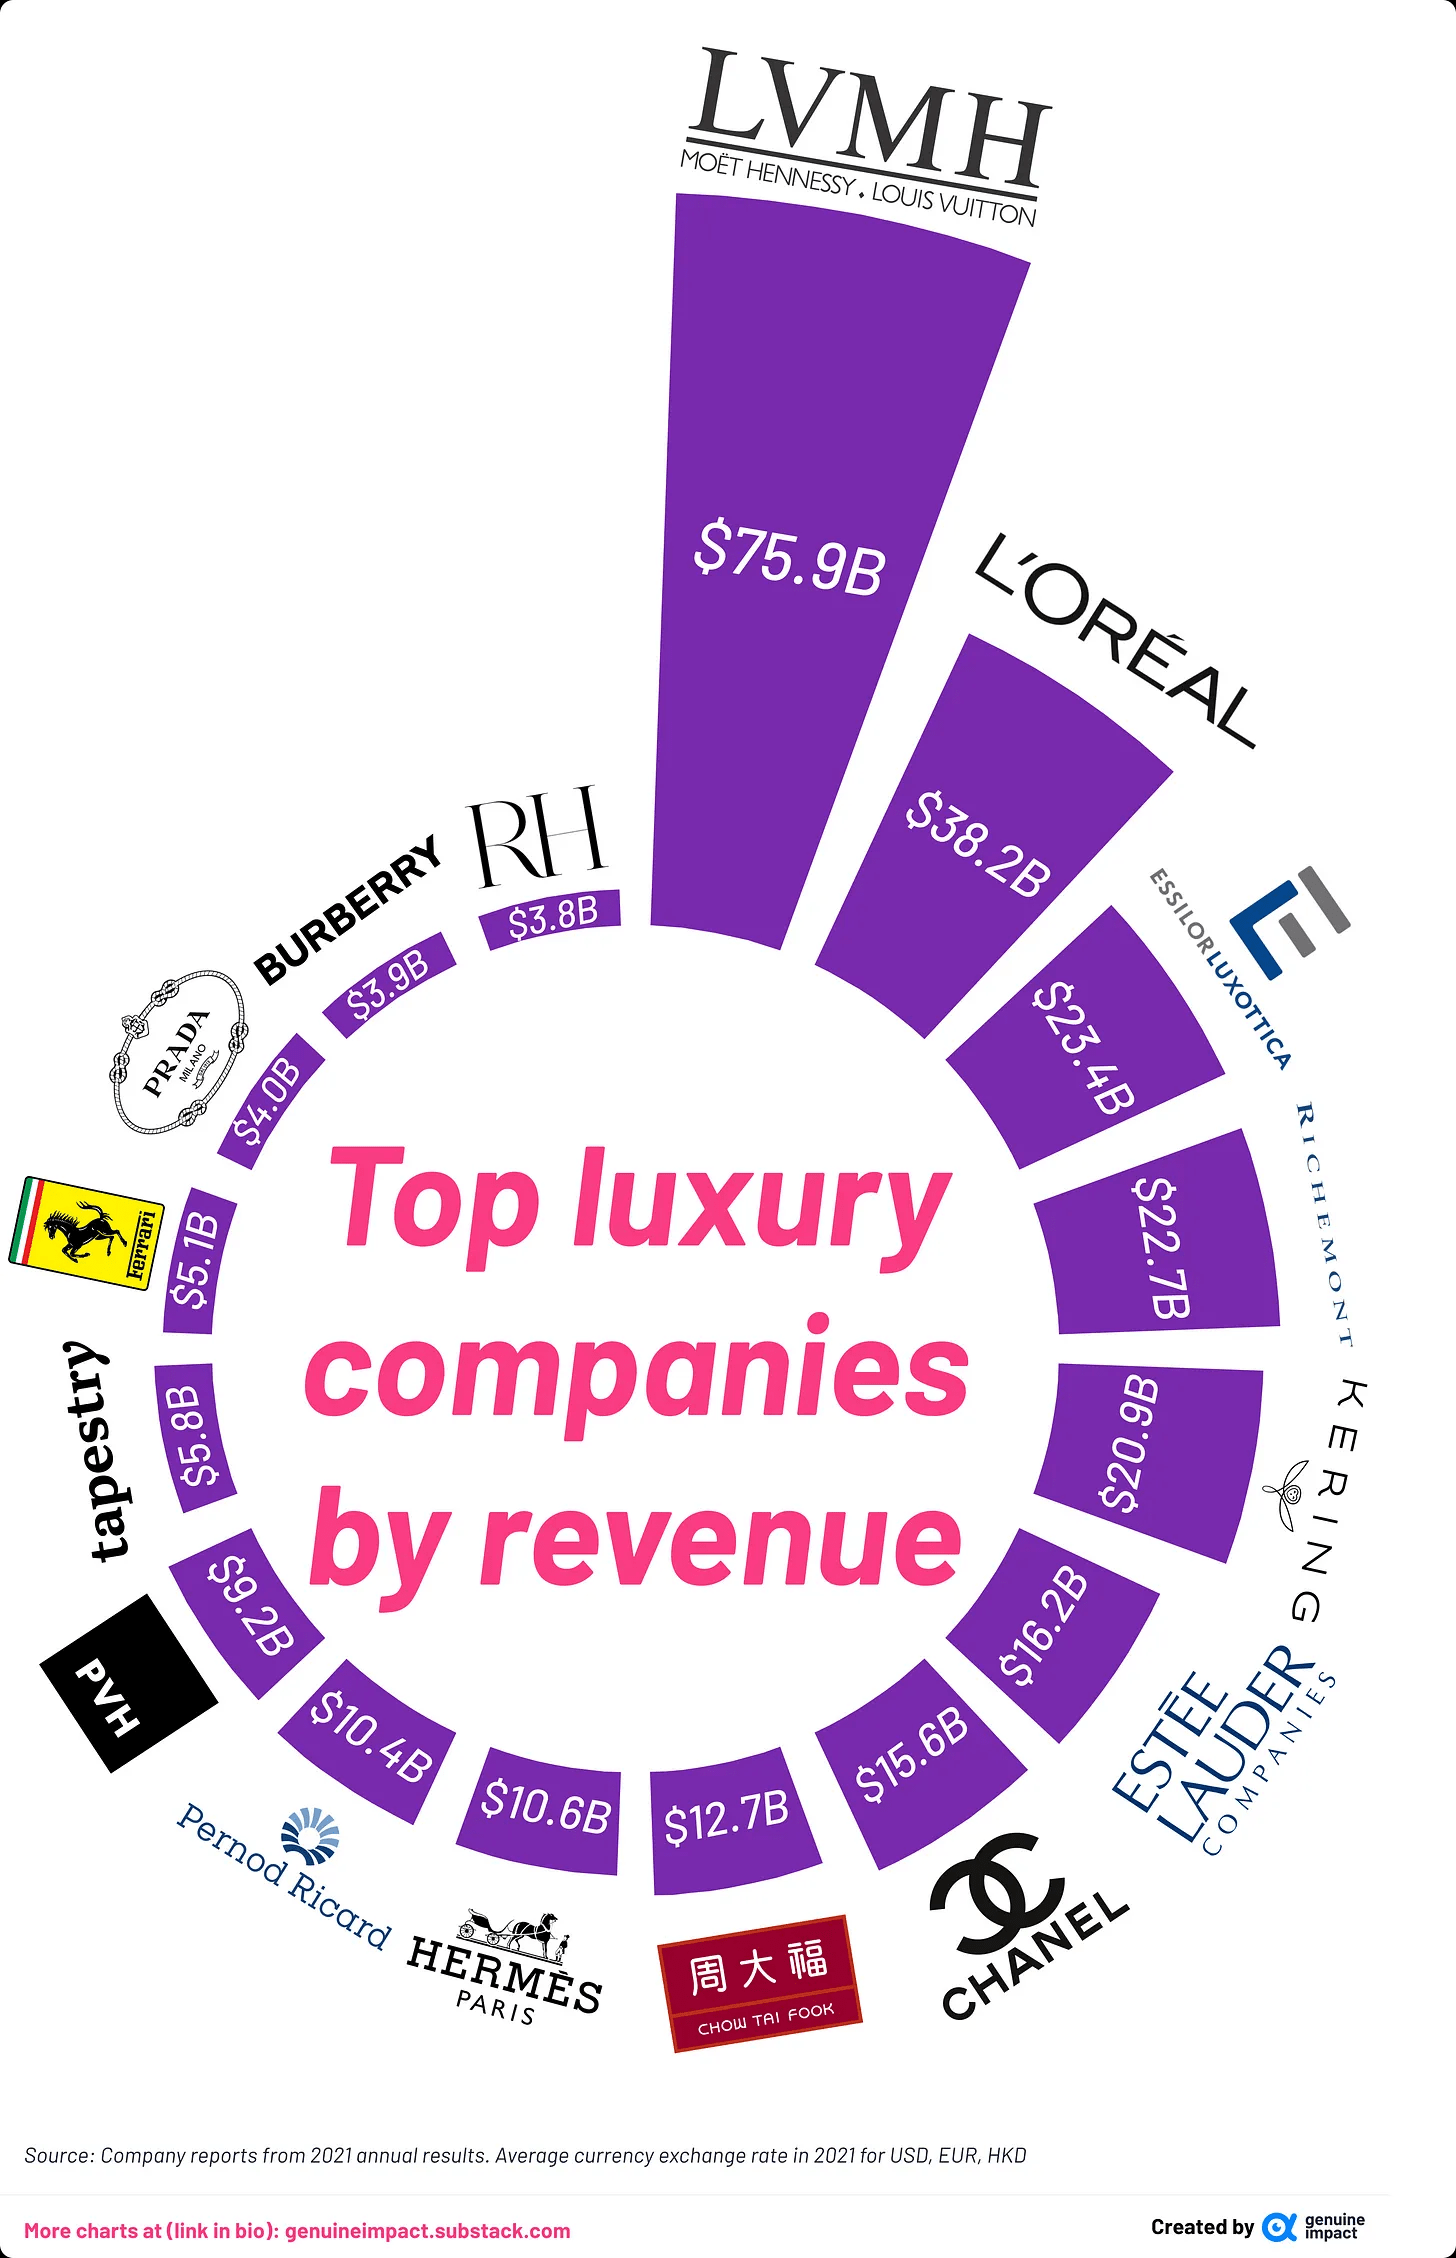
Source: 6 new charts on luxury stocks – part 1 by Truman, Substack
Referenced firms:
- LVMH Moet Hennessy Louis Vuitton SA (LVMUY)
- L’Oreal (LRLCY)
- Hermes Intl (HESAY)
- Pernod Ricard (PRNDY)
- Estee Lauder Companies (EL)
- Kering (PPRUY)
- EssilorLuxottica (ESLOY)
- Tapestry Inc (TPR )
Disclosure: No positions