Apple IPO (1980) vs. Now (2021)

Apple(APPL) is one of the world’s most valuable companies today with a market cap of over $2.5 Trillion. It too many decades for Apple to get to where it is now. When the company did its IPO in 1980 it was mainly known for its personal computers. That is no longer the case. The Apple of today is famous for multiple products from iPhones to iPods to everything in between.

The brand has such a huge cult-like followers that the firm’s pricing model for its products is astonishing to say the least. They even sell a cleaning cloth for $19.00 ! This piece of cloth is probably worth a couple of bucks at the most. Eventually Apple may extend its brand’s power by rolling out new Apple-branded products outside of electronics such as hotels, restaurants, paper towels, cereals, toys, appliances, cars, cookies, apparel, coffee, mouth wash, shoes, tooth brush, beer, wine, potato chips, resorts, airlines, pens, perfume, bottled water, toothpaste, bulbs, etc. and turn into a conglomerate worth some $10 Trillion or more.

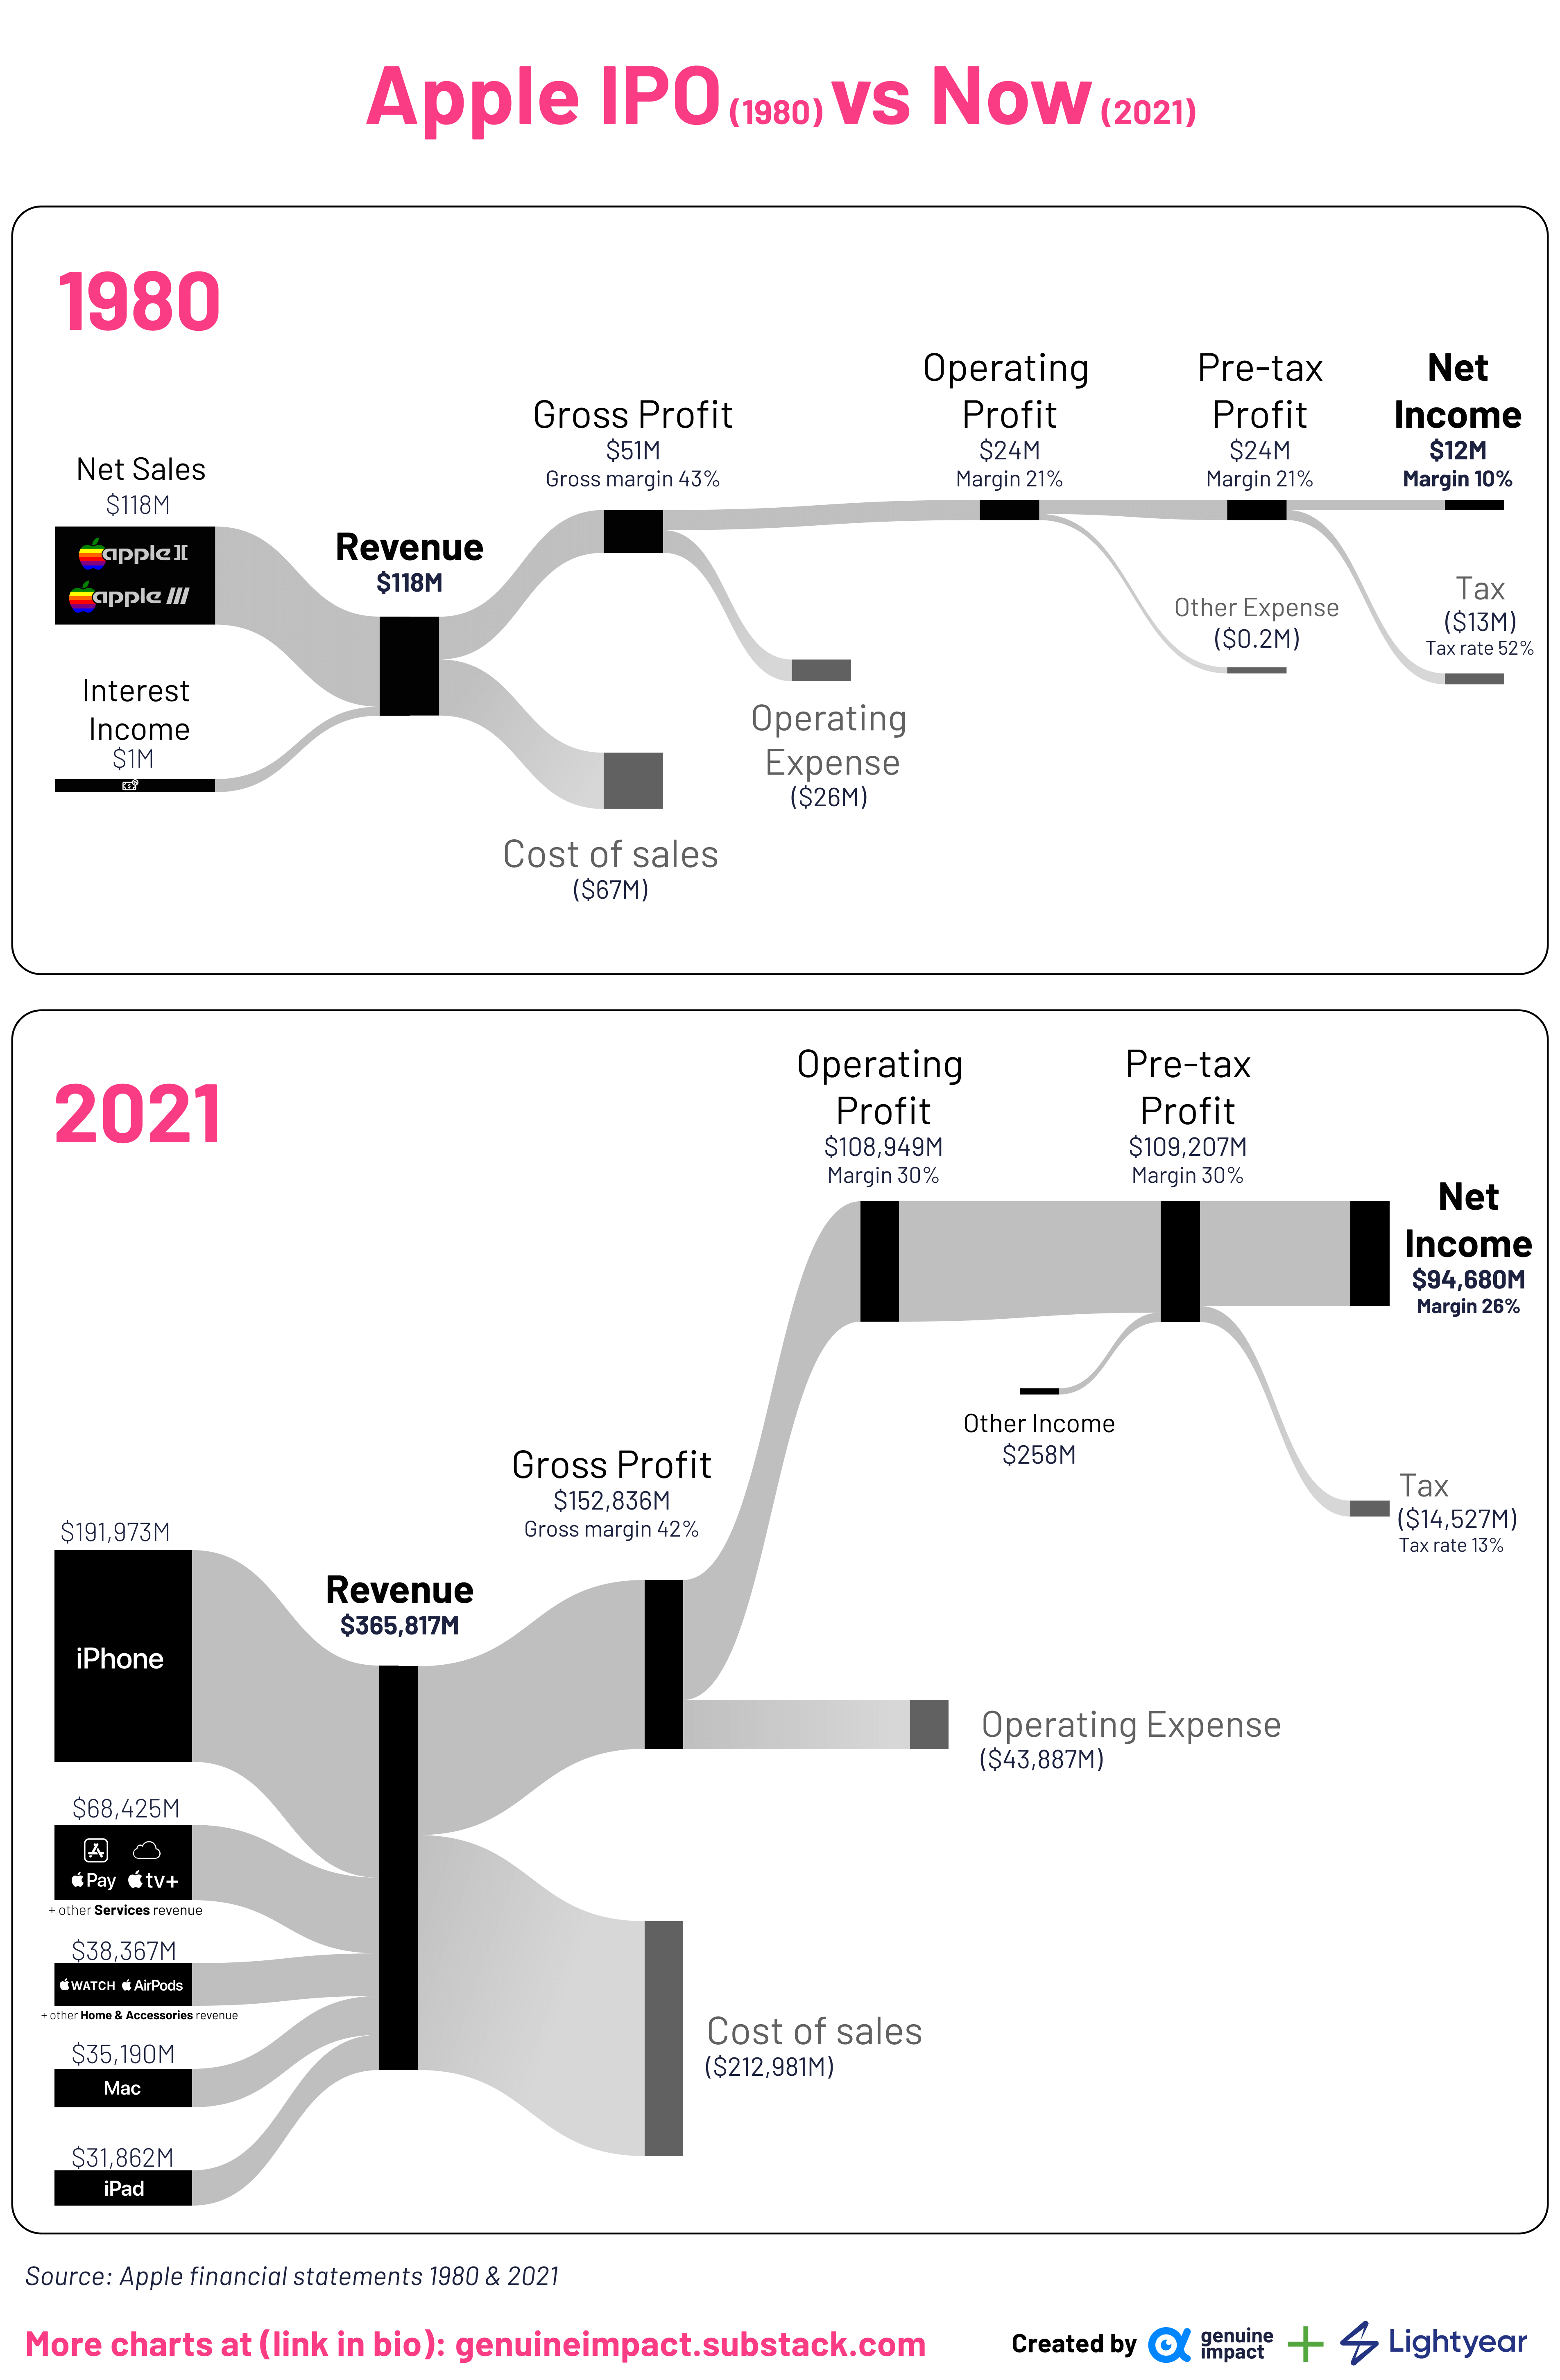
Source: Now vs. IPO: Apple, Amazon, Microsoft, Google & Tesla by Truman, Genuine Impact Newsletter

Hat Tip: Market Index

At its IPO, Apple had a revenue of just $118 million. By 2021, that revenue increased by over 3,000 times. The tax rate plunged from 52% to just 13% which is great for investors.

Disclosure: No positions

The Top 10 Global Pharmaceutical Companies 2022

The global pharmaceutical industry continues to grow and was up by an astonishing $1.4 Trillion in 2021. The Covid-19 pandemic gave a big boost to the industry. According to an article at ProClinical, the FDA approved 50 drugs in 2021 and M&A activity also picked up. With that brief intro, let’s take a look at the Top 10 Global Pharmaceutical firms in 2022 based on revenue so in 2021:

Click to enlarge

Source: Who are the top 10 pharmaceutical companies in the world? (2022), Proclinical

US pharma giant Pfizer was the top ranked firm in 2021 jumping from the sixth spot in previous year. Pfizer’s Covid-19 vaccine Comirnaty was a top contributor to its revenue with sales of over $37 billion. Pfizer was the first company to develop an effective vaccine for Covid-19 with its German partner BioNTech (BNTX). In December 2021, Pfizer received the FDA’s approval for its oral Covid-19 pill called Paxlovid.

AbbVie was the second top pharma company with sales of over $56 billion. One of the its best performing drug is Humira, the rheumatoid arthritis blockbuster.

The rest of the firms in the above list are the usual leaders. UK-based GlaxoSmithKline(GSK) came in at number 10 with sales of over $32 billion last year.

Referenced Companies:

  • Pfizer(PFE)
  • AbbVie Inc (ABBV)
  • Johnson & Johnson (JNJ)
  • Novartis AG (NVS)
  • Roche Holding AG (RHHBY)
  • Bristol-Myers Squibb Co (BMY)
  • Merck & Co Inc (MRK)
  • AstraZeneca (AZN)
  • Sanofi (SNY)
  • GlaxoSmithKline (GSK)

Disclosure: No positions

Fact of the Day: Black Monday

Black Friday was one of the worst days in US stock market history. On Oct 19, 1987 the Dow Jones Industrial Average plunged by an astonishing 22.6% in the session wiping out billions in market value.

If the Dow were to fall the same percentage on Monday it would lead to a loss of 7,024 points !

While most investors know about this Black Monday, not many may were aware of this fact: Despite the huge one day decline, the Dow ended the year 1987 with a gain of 2%.

Source: Financial Flashback, Oct 10, 2022, WSJ

Related ETF:

  • SPDR Dow Jones Industrial Average ETF (DIA)

Disclosure: No positions

International Tax Competitiveness Index Rankings 2022: Chart

The Tax Foundation recently published the International Tax Competitiveness Index report for 2022. This is a fascinating study that measures important factors related to taxes and ranks the OECD countries. Estonia ranked 1 this year with the best tax code followed by Latvia and New Zealand. The US came in at number 22, the same as last year just below Japan but ahead of Slovenia.

From the report:

The International Tax Competitiveness Index (ITCI) seeks to measure the extent to which a country’s tax system adheres to two important aspects of tax policy: competitiveness and neutrality.

Click to enlarge

Source: International Tax Competitiveness Index 2022, The Tax Foundation

Below is an excerpt from the report that discusses how the ITCI index was measured:

To measure whether a country’s tax system is neutral and competitive, the ITCI looks at more than 40 tax policy variables. These variables measure not only the level of tax rates, but also how taxes are structured. The Index looks at a country’s corporate taxes, individual income taxes, consumption taxes, property taxes, and the treatment of profits earned overseas. The ITCI gives a comprehensive overview of how developed countries’ tax codes compare, explains why certain tax codes stand out as good or bad models for reform, and provides important insight into how to think about tax policy.

Due to some data limitations, recent tax changes in some countries may not be reflected in this year’s version of the International Tax Competitiveness Index.

One of the weaknesses of the US tax system is the high real property tax burden. This is not surprising. Property taxes in the US are as local as you can get. So naturally it has turned into a vehicle for states to add all kinds of extra items each year to jack up the rate. The following are the strengths and weaknesses of our tax system, as per this study:

✔️ Some strengths of the U.S. tax system:

The U.S. provides full expensing for business investments in machinery.

The U.S. allows for Last-In-First-Out treatment of the cost of inventory.

Corporations can deduct property taxes when calculating taxable income.

❌ Some weaknesses of the U.S. tax system:

U.S. states’ sales taxes apply on average to less than a third of the potential tax base.

The U.S. has a partial territorial system and does not exempt foreign capital gains income.

The real property tax burden is among the highest in the OECD.

There are many other interesting facts in this report on each country. So readers may want to visit the foundation’s site for the full report.

S&P 500 Price Return vs. Total Return: Charts

Many investors focus on the price return of the S&P 500 index when they consider their investment return Instead investors ought to pay attention to the total return which includes dividends reinvested. The total return of the index can especially be much higher the price return when looking at many years. This is because of the effect of compounding.

Though the average dividend yield on the index has been around 2% for many years, the returns are amplified over the years due to compounding. The following chart shows the difference in returns over two decades:

Click to enlarge

Source: Price return VS total return : don’t get confused !, Camille Van Vyve, easyvest

The key point to remember is that the gap between price and total return over short period such as one year won’t me much. For instance, the price return in 2021 for the S&P 500 was 26.9% while the total total return was 28.7%. The following chart shows the returns over ten years ending in December, 2021:

Click to enlarge

Source: Income Opportunities: Examining Price and Total Return in 2021 by Roxanna Islam, Alerian

Related ETFs:

  • SPDR S&P 500 ETF (SPY)
  • SPDR S&P Dividend ETF (SDY)

Disclosure: No positions