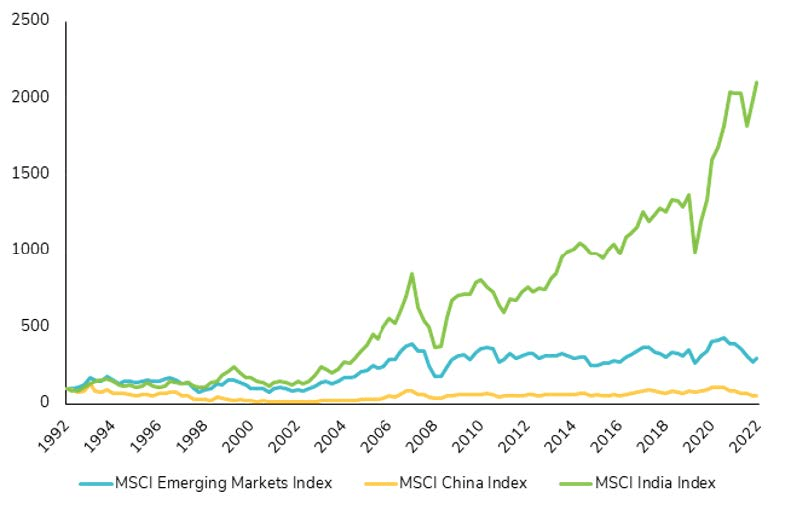
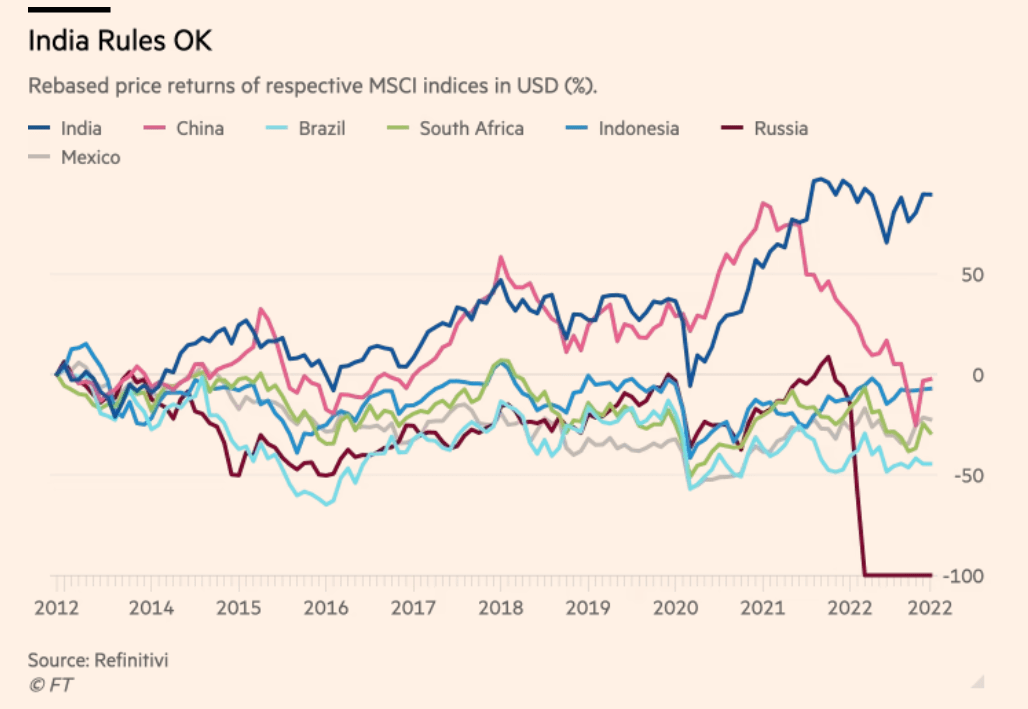
Emerging markets have been poor performers for the past decade or so. Many years ago the BRICS were supposed to lead the growth of these markets. However that did not work out as expected. For instance, the decline in commodity markets led to the fall of Brazilian equities which were soaring during the commodity bull run. Political changes and poor economic policies added to the woes of investors.
Similarly decline in oil prices and more recently the shutting down of foreign listings of domestic companies made Russia one of the top worst performing markets. Economic contraction followed by Covid induced further decline in growth made Chinese equities average to poor performers. Overall most emerging markets are losers for equity investors.
However according to an article by James Johnstone at Redwheel, that emerging markets have reached an inflexion point and are attractive based of valuation. From the article:
Attractive valuations versus developed markets
The demand for metals is expected to support the growth of emerging markets and widen the real GDP growth differential with western markets. This marks forward price-to-earning (P/E) ratios for the sector look attractive.
In part, this is attributable to the commitment of emerging nations to maintain tight monetary policy over the past decade. These economies have largely avoided using unconventional policies (such as quantitative easing). They also raised rates before developed economies – and remain ahead of the curve.
As developed economies struggle with soaring inflation and interest rates, monetary constraint has made emerging market economies resilient.
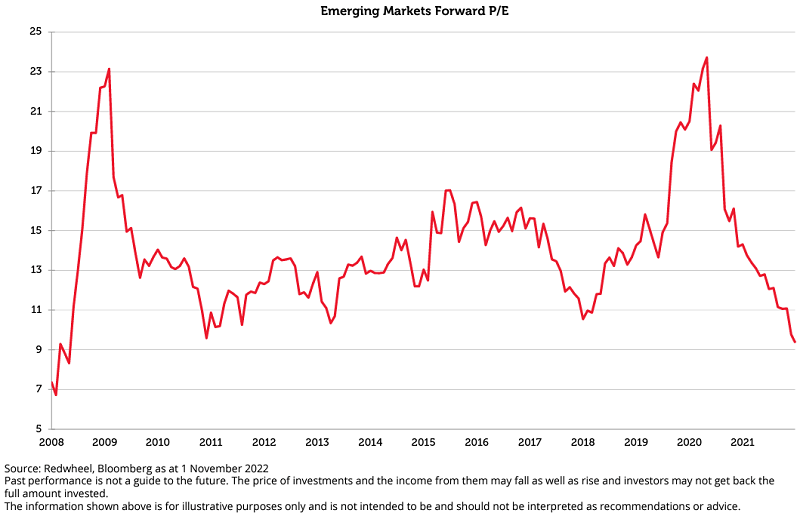
Emerging markets have fallen to valuation levels not seen since 2008 while earnings continue to climb.
Source: Why emerging markets have reached an inflexion point by James Johnstone via FirstLinks
From an investment perspective, it is simpler and easier to invest in an ETF than individual companies. Unlike developed market equities, stocks in developing countries can be more risky and volatile for a multitude of reasons. So in order to avoid unnecessary risk and still have exposure to these markets is to go with ETFs.
Related ETFs:
- iShares MSCI Emerging Markets ETF (EEM)
- Vanguard MSCI Emerging Markets ETF (VWO)
- iShares MSCI Mexico Capped Investable Market (EWW)
- Global X FTSE Colombia 20 ETF (GXG)
- iShares MSCI Brazil Index (EWZ)
- WisdomTree India Earnings (EPI)
- The iShares MSCI India ETF (INDA)
Disclosure: No Positions