The US equity market has been one of the best performing markets in the world over the long term. The benchmark S&P 500 has grown steadily through various crises and events from 1970 thru 2022. Based on total returns of the index an investment of $10,000 in 1970 would have risen in value to over $2 million or $,2,209,027 as of March end, 2022. The average annual total return of the S&P 500 index during the period shown was 10.88% which is pretty good.
Click to enlarge
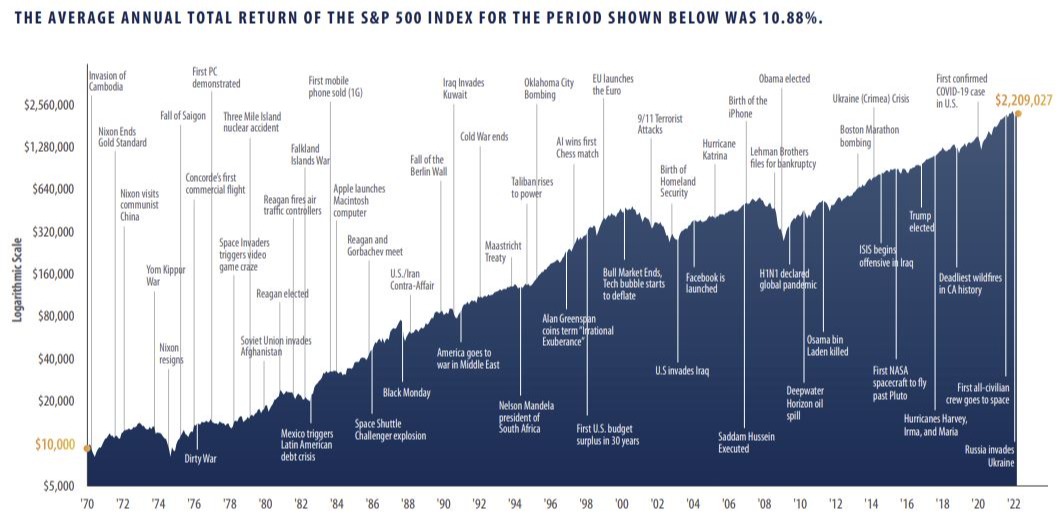
Source: Bloomberg. Data from 12/31/1969 – 3/31/22. Past performance is no guarantee of future results. This chart is for illustrative purposes only and not indicative of any actual investment. The S&P 500 index is an unmanaged index of 500 companies used to measure large-cap U.S. stock market performance. Investors cannot invest directly in an index. Index returns do not reflect any fees, expenses, or sales charges. Stocks are not guaranteed and have been more volatile than the other asset classes. These returns are total returns and were the result of certain market factors and events which may not be repeated in the future
Source: MARKET PERSPECTIVE CHARTS by Edwin L. “Lee” Peters, III, Peters Financial
The key takeaway is not to focus too much on daily or short-term gyrations of the market and keep an eye on the long term goal of one’s investment in equities.
Related ETFs:
Disclosure: No positions


