Happy New Year to all !

Frozen Waterfalls, West Virginia
Regular posting will resume this week. Hopefully 2023 will be better than last year for equity investors.
Happy New Year to all !
Frozen Waterfalls, West Virginia
Regular posting will resume this week. Hopefully 2023 will be better than last year for equity investors.
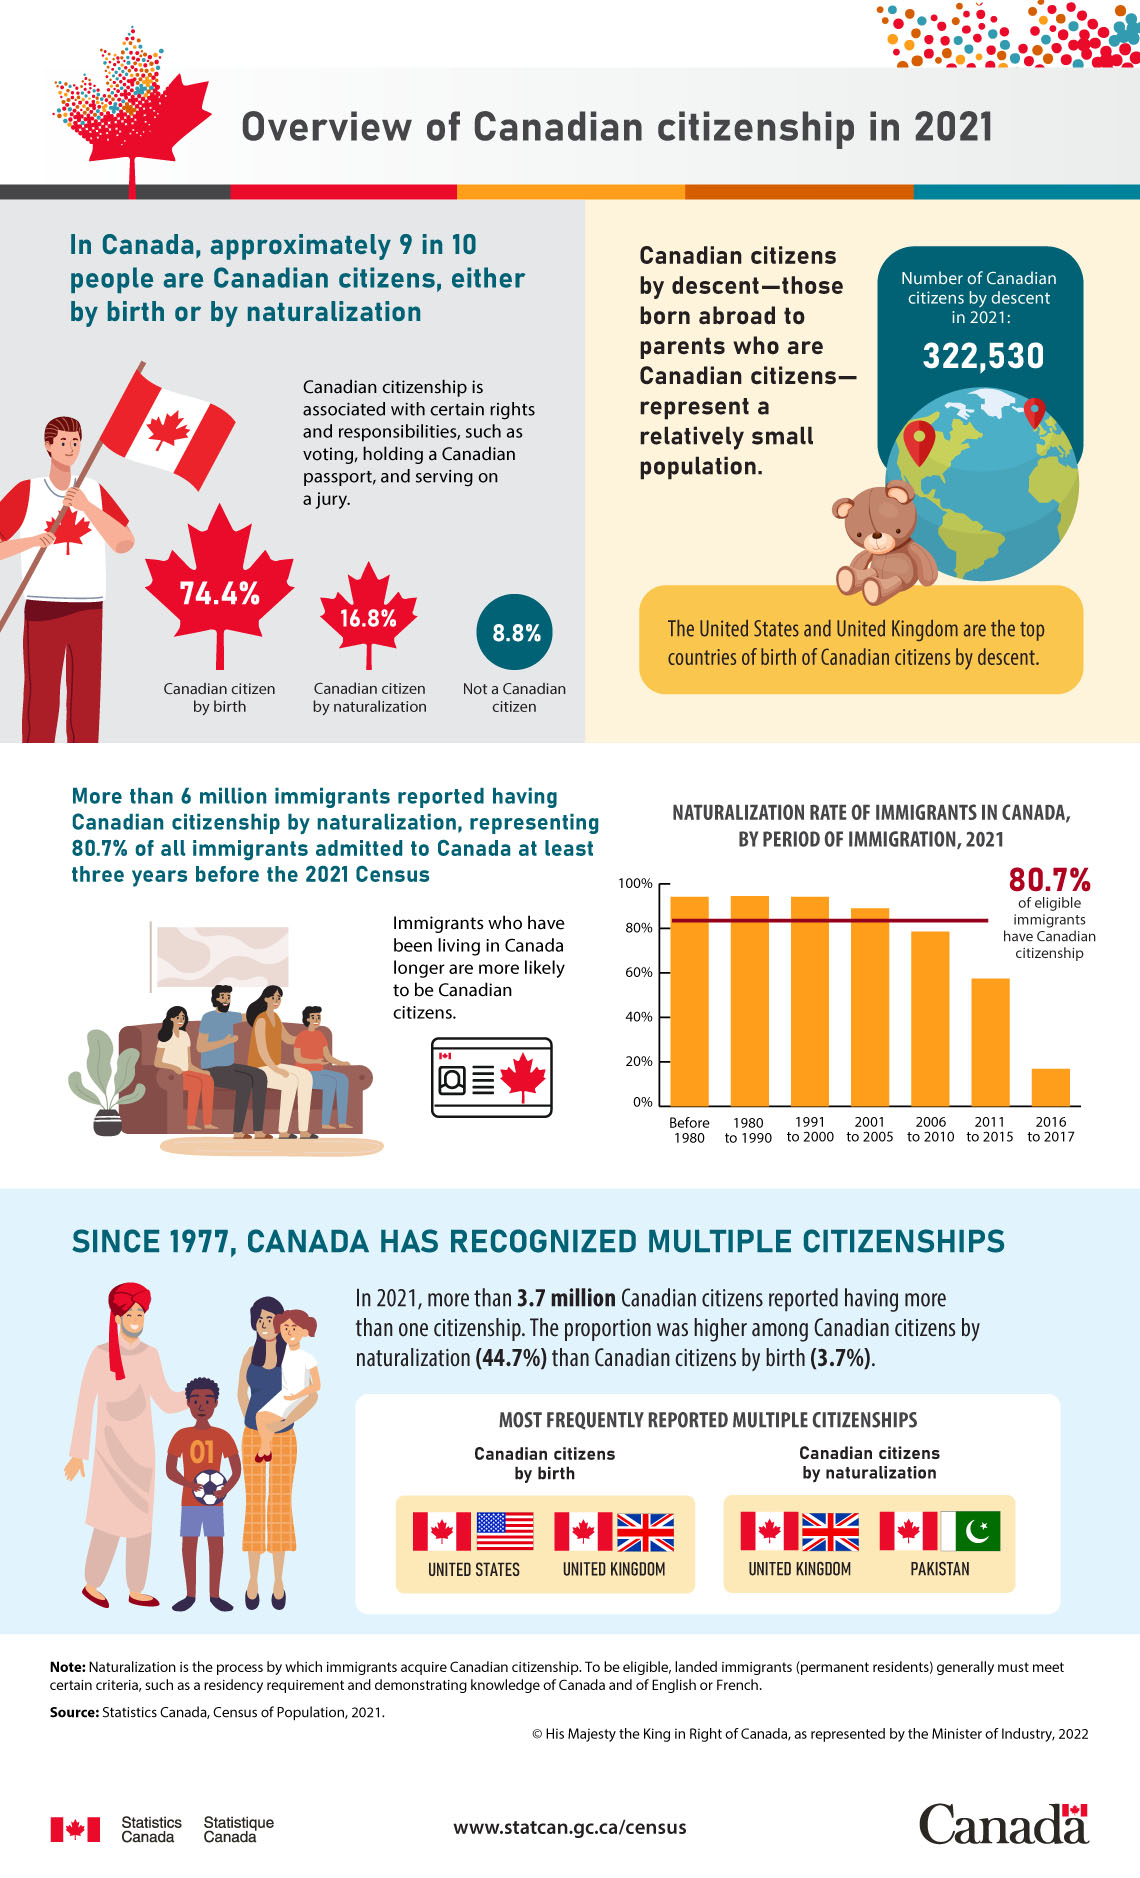
I came across the following infographic on Canadian Citizenship data in 2021. It interesting to note that the US and UK are the top two countries of birth of Canadian citizens by descent. Similarly among Canadian citizens by birth who own dual citizenship are with the US and UK.
Click to enlarge
Source: Statscan
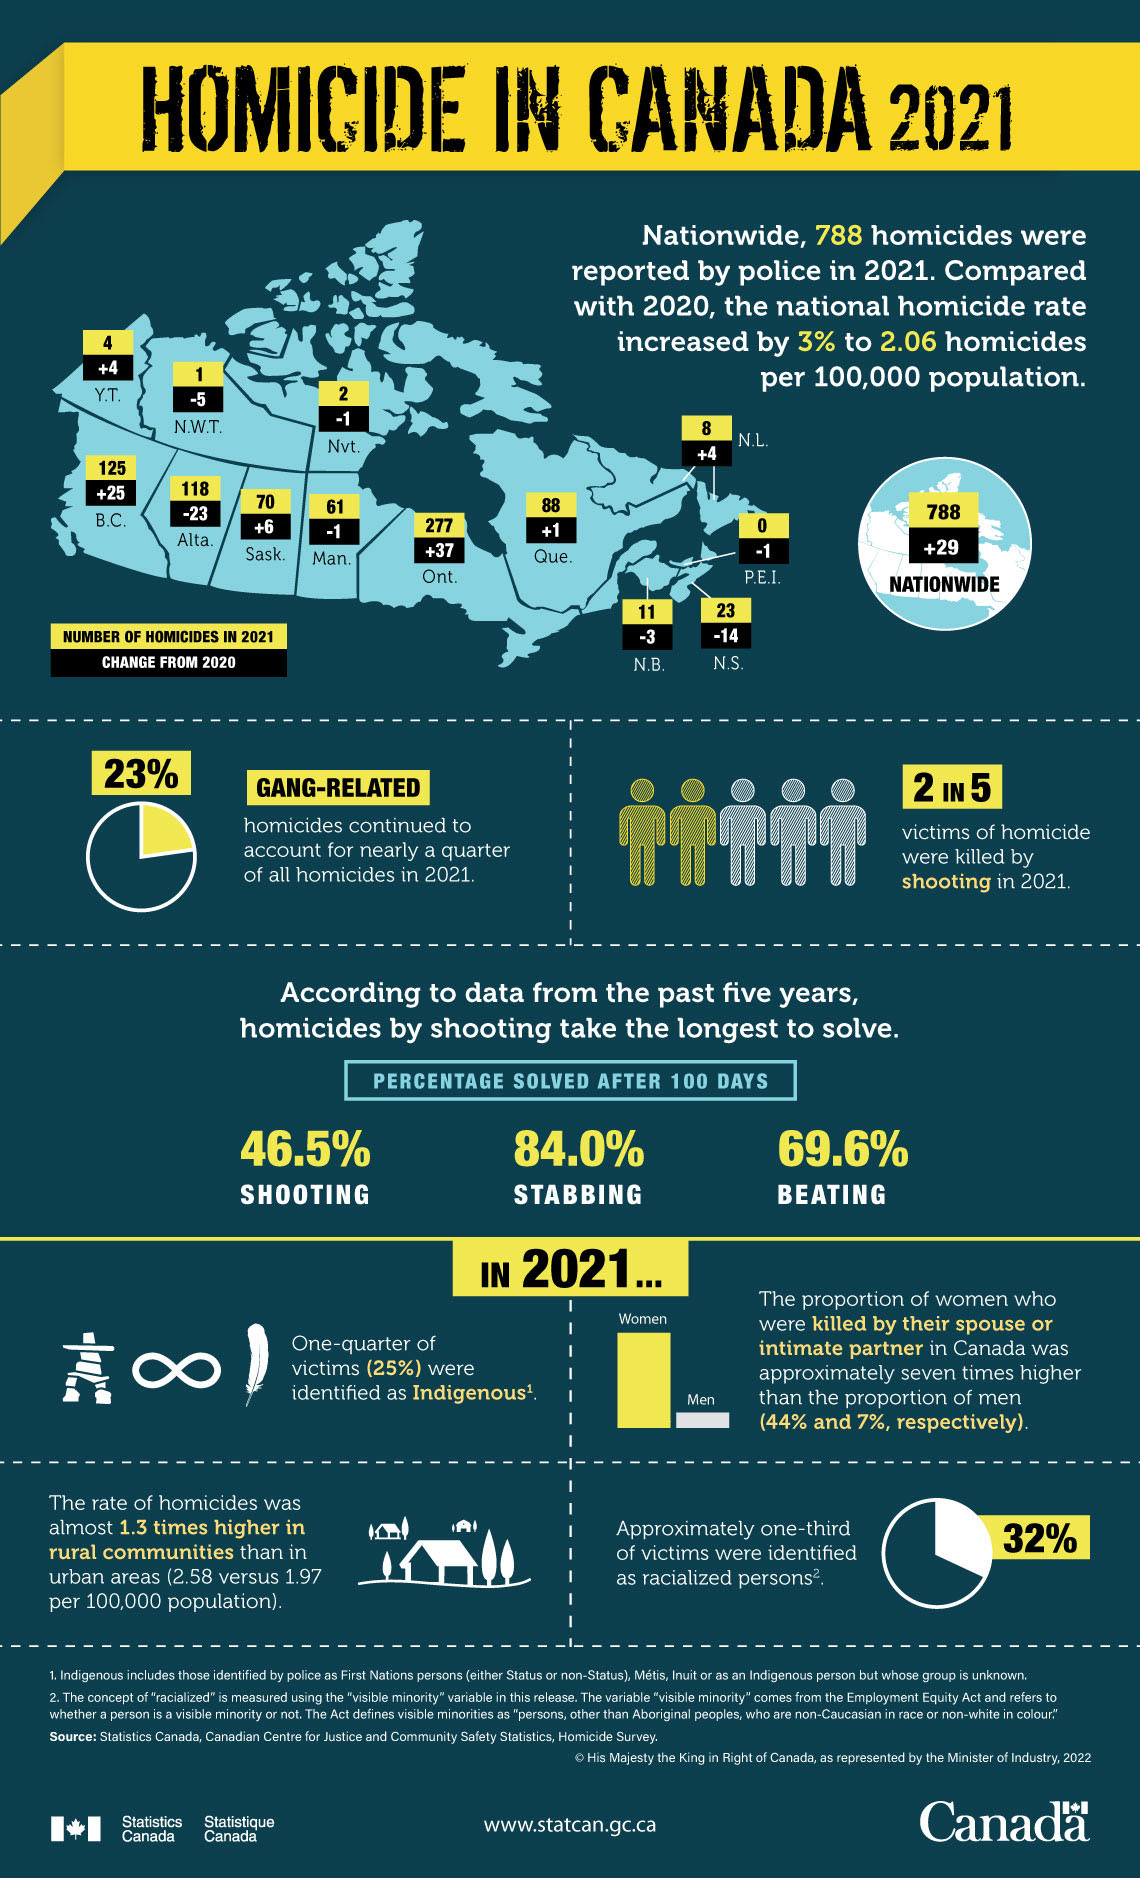
The population of Canada is 38.25 million according to The World Bank per Google. In 2021, the country had 788 homicides. This represents 2.06 homicides per 100,000 population.
To put this figure in perspective, the US had a population of 332 million in 2021. Last year there were 22,900 homicides in the country according to the FBI. The homicide rate was 6.9 per 100,000 population. So the homicide rate in the US more than three times the rate in Canada, our northern neighbor.
With that said, the following infographic shows some additional facts about homicides in Canada in 2021:
Click to enlarge
Source: Statscan
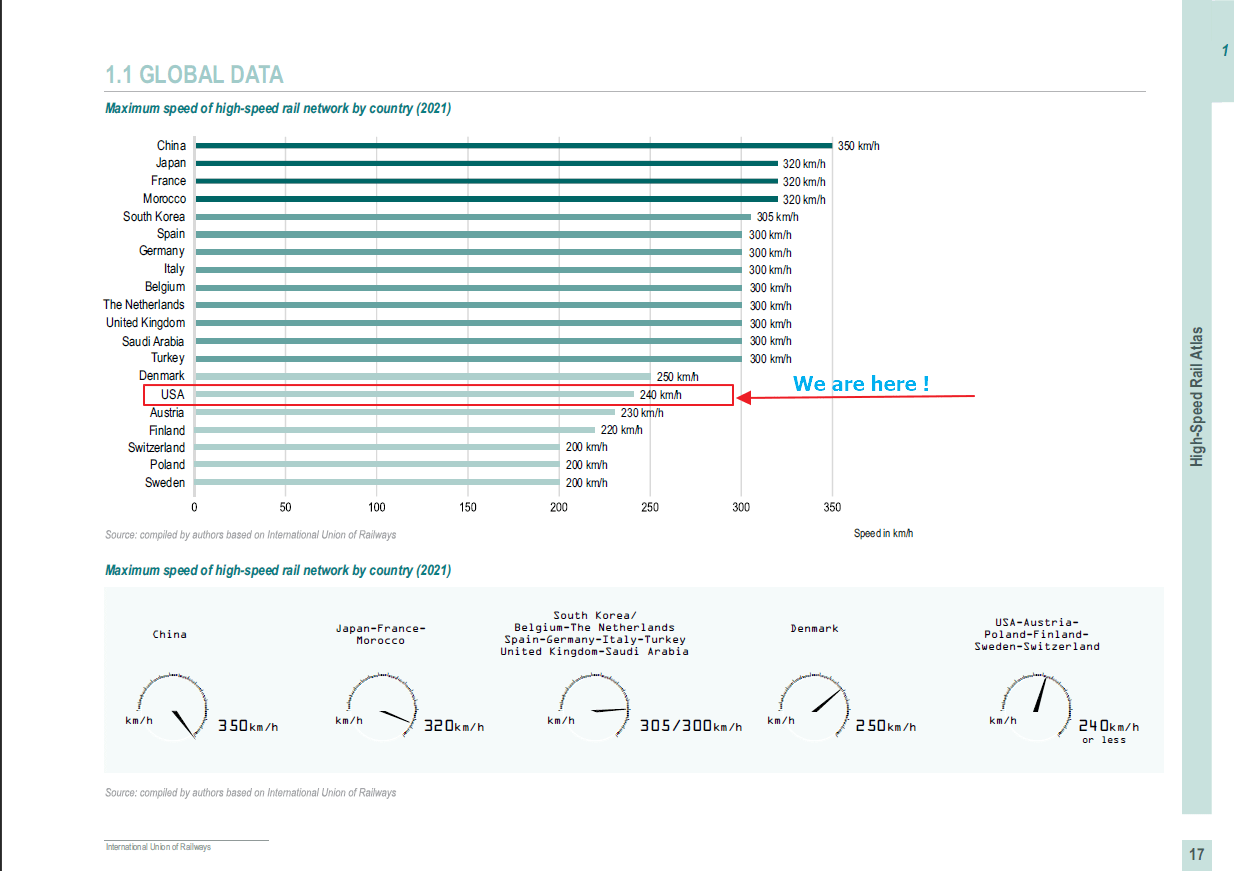
High speed rail networks continue to grow in countries around the world. Technological advancements have also led to pushing the speed higher and higher. As of 2021, the top speed in high-speed rail is in China with a maximum speed of 350 km/hr according to the Atlas High-Speed Rail 2022 report published by the International Union of Railways (UIC). Japan, the original high-speed champion, France and Morocco are second with a max speed of 320 km/hr. Many other countries including Spain, Italy, etc. have speeds of 300 km/hr or more.
Maximum Speed of High-Speed Rail Network by Country 2021:
Click to enlarge
Source: Atlas High-Speed Rail 2022 , International Union of Railways (UIC)
The maximum speed of high-speed rail network in the US is 240 km/hr. In terms of both speed and network in operation China is far ahead of the US.
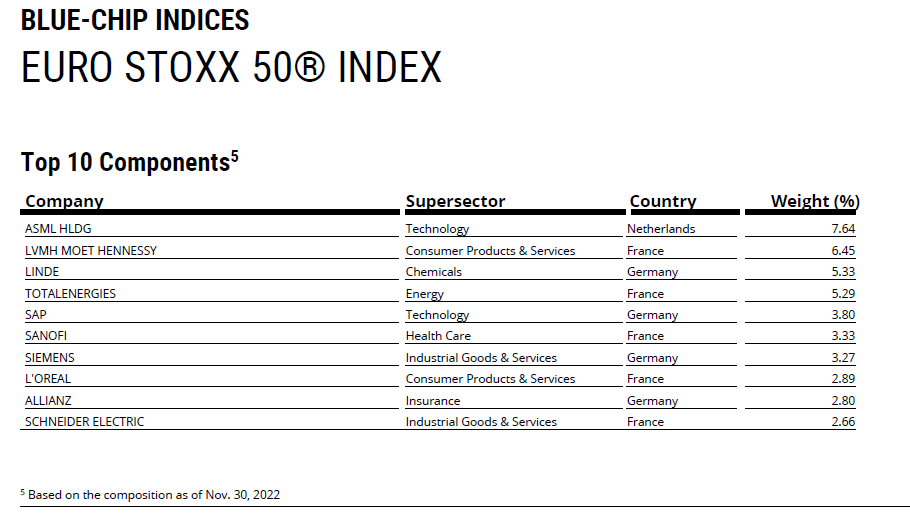
The simple and easy way to invest in Eurozone blue chips is with an ETF that tracks the The EURO STOXX 50® Index. This index represents the 50 largest companies in the Eurozone countries based on free-float market cap. The companies include the major sectors such as technology, banks, industrial goods, consumer good, chemicals, etc. The following chart shows the sectors and the country weighting:
Click to enlarge

Source: Stoxx
The Top 10 index constituents are shown in the graphic below:
Source: Stoxx
The long-term return of the index is shown below:
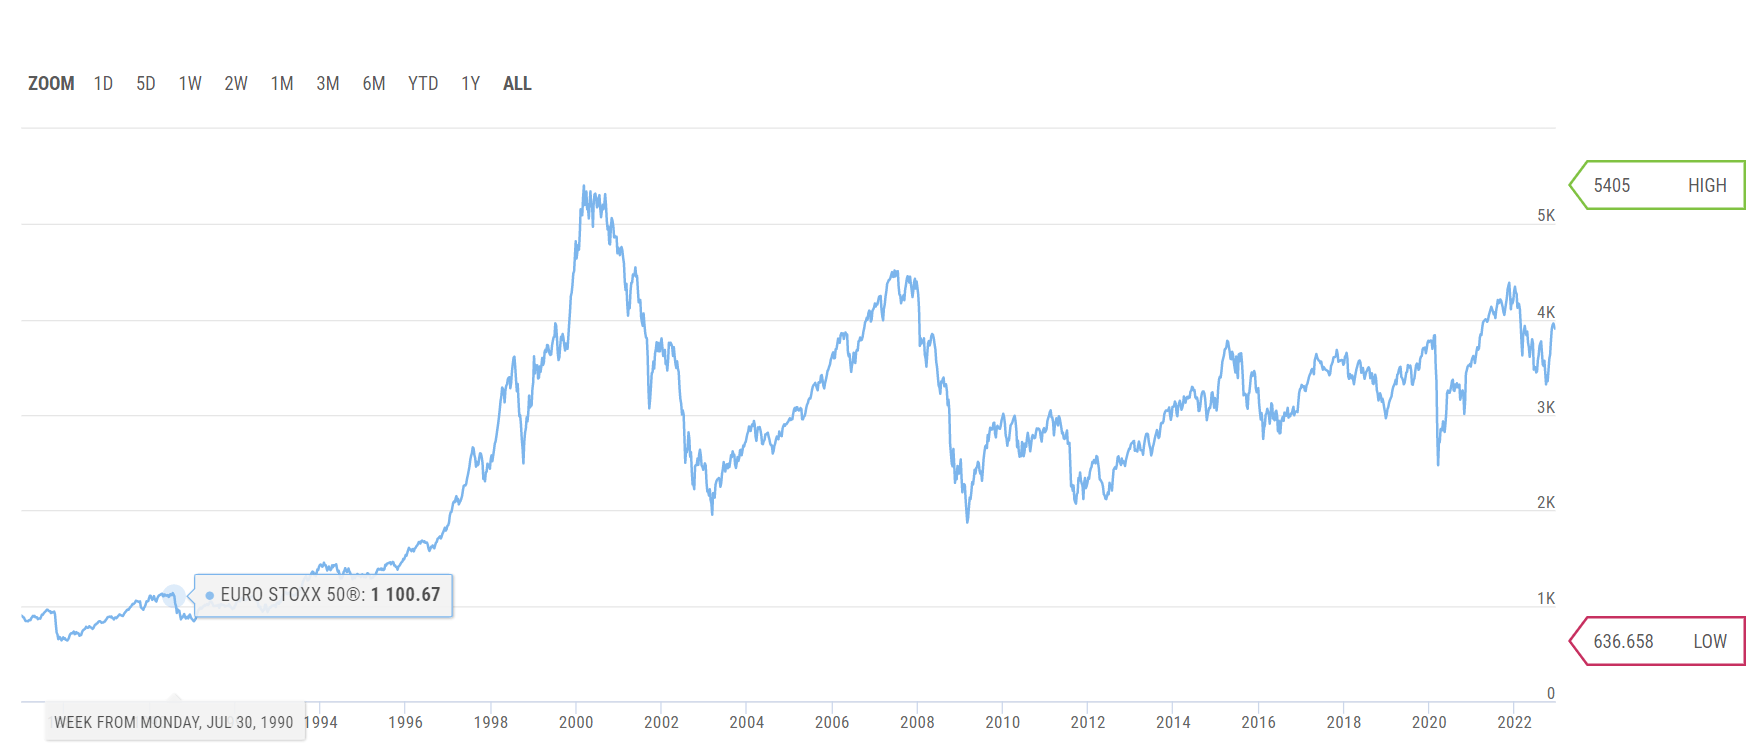
Source: Stoxx
The SPDR® EURO STOXX 50® ETF (FEZ) tracks the Euro Stoxx 50 index. Currently the fund has an asset of $1.90 Billion and a gross expense ratio of 0.29%. In line with the overall market, the fund is down 17% YTD. Over the past 5 years it has been a poor performer with a loss of 2%.
For investors interested in individual stocks, the tickers of the top 10 in the ETF are listed below:
Disclosure: No positions