The US equity market is one of the best in the world in terms of returns. In the past 151 years, the US stock market has produced an average return of 8.4% per year. The following chart shows the annual real total returns from 1822 to 2022:
Click to enlarge
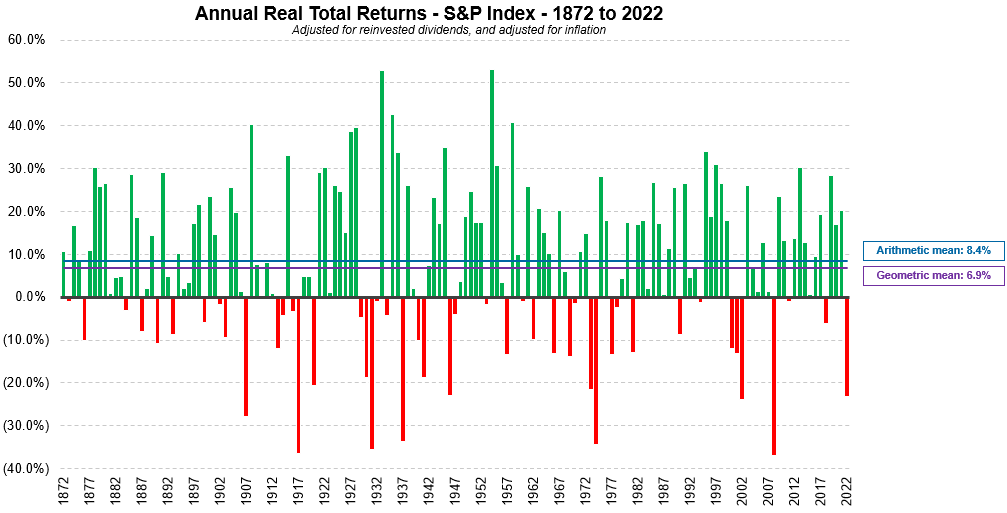
Source: U.S. Stock Market Returns – a history from the 1870s to 2022, The Measure of a Plan
While the above chart is interesting, it is better to look at returns on a decade basis. The chart below shows the returns by decade including the price return, total return and real total return which is adjusted for inflation:
Click to enlarge

Source: U.S. Stock Market Returns – a history from the 1870s to 2022, The Measure of a Plan
A few takeaways from the above charts:
- Over the long run equities yield a positive return.
- In most decades stocks beat inflation.
- In the entire period shown above, just during the Global Financial Crisis(GFC) decade, the total return was negative.
Related ETFs:
- SPDR S&P 500 ETF (SPY)
- iShares Core S&P 500 ETF (IVV)
- Vanguard S&P 500 ETF (VOO)
- SPDR Portfolio S&P 500 ETF (SPLG)
The Complete List of Constituents of the S&P 500 Index can be found here.
Disclosure: No positions


