Lloyds leaps back to profit, seeks dividend approval (CityWire, UK)
Six Years After Crisis, Banks Are Poised to Rule the S&P 500 (Bloomberg)
Frontier markets: A contrarian defensive play? (Trustnet)
Have we seen the worst of the gold stock horror show? (Financial Post)
Revolution hits the potash market: is this a buying opportunity? (MoneyWeek)
20 U.S. stocks mixing value, profit growth (The Globe and Mail)
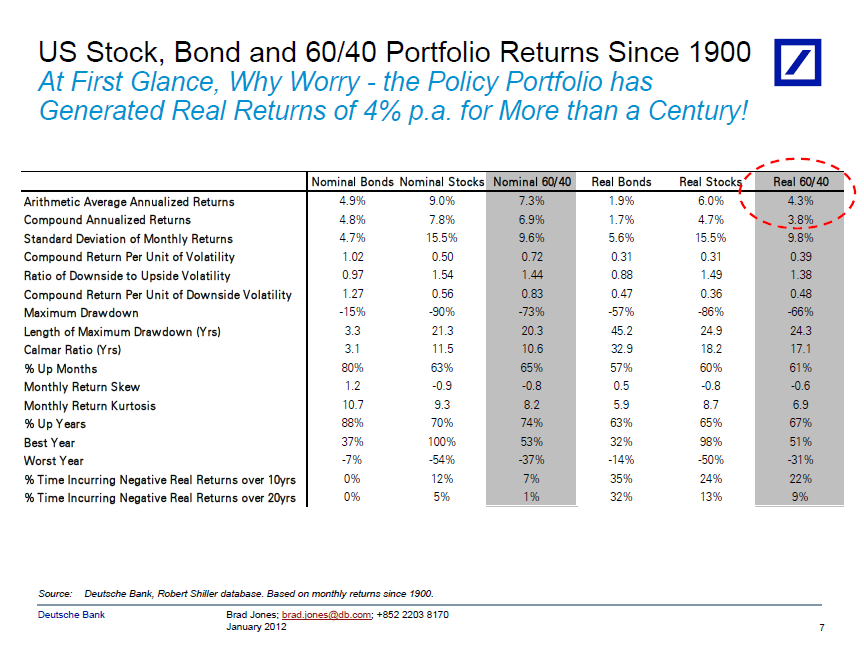
Hidden pitfalls of leverage (MarketWatch)
Global income convergence – myth and reality (Deutsche Bank Research)
Will China’s economy avoid the doldrums? (OECD Observer)

Chicago