The World Economic Forum publishes The Global Risks report every year when its annual meeting takes place in Davos, Switzerland.
The latest report lists the following as the Ten Global Risks of Highest Concern in 2014:
- Fiscal crises in key economies
- Structurally high unemployment/underemployment
- Water crises
- Severe income disparity
- Failure of climate change mitigation and adaptation
- Greater incidence of extreme weather events (e.g. floods, storms, fires)
- Global governance failure
- Food crises
- Failure of a major financial mechanism/institution
- Profound political and social instability
The chart below shows the global risks mapped to their likelihood of occurring and impact:
Click to enlarge
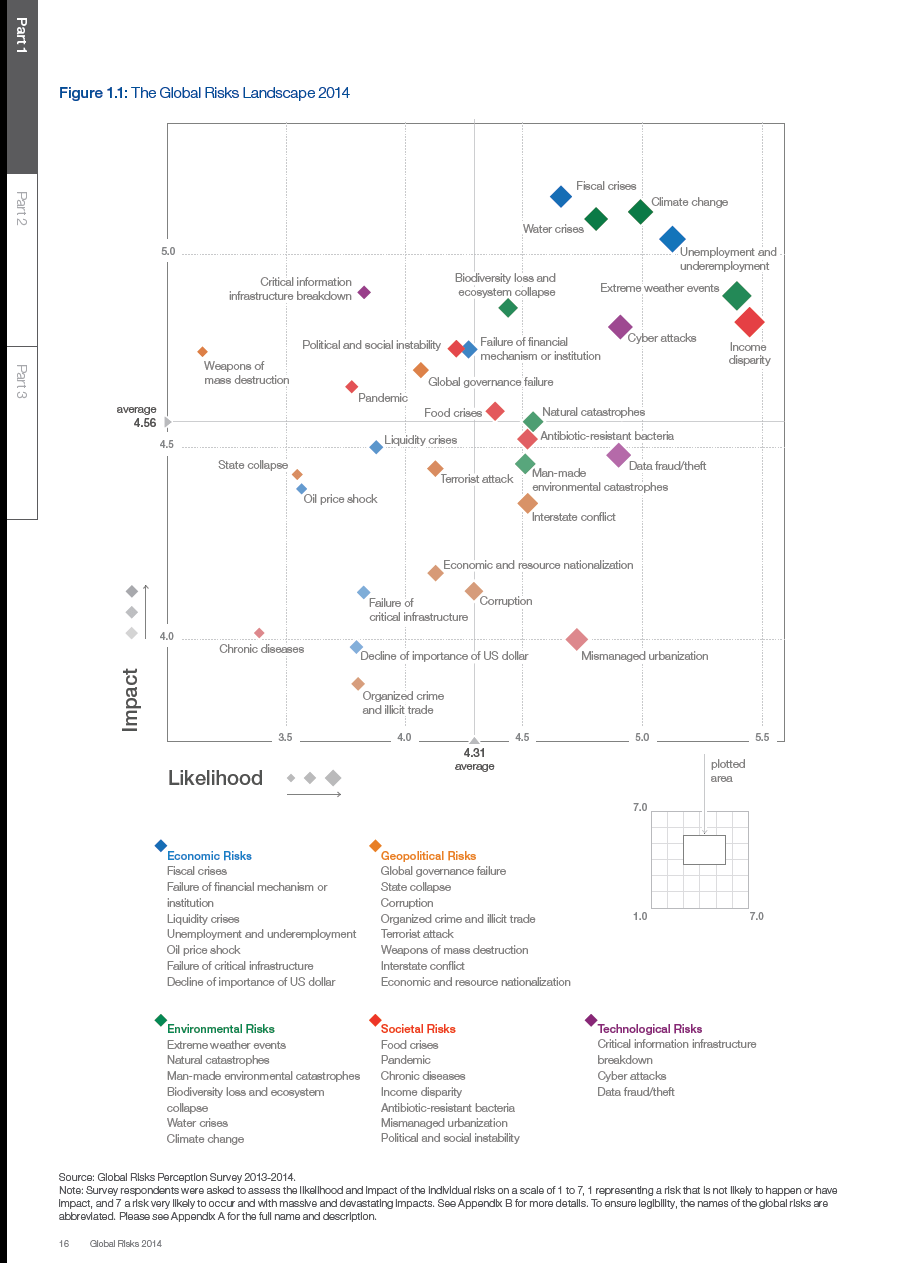
Source: Global Risks 2014 Ninth Edition, Insight Report, World Economic Forum
It is surprising that fiscal crises in key economies appears as the top risk of highest concern for this year even though we had multiple crises in the past few years including the global financial crisis and sovereign debt crises in Europe.