The potential for European companies to raise dividend payouts is high since currently the payout ratio is lower than in the past according to a Allianz Global Investors report.
Click to enlarge
From the report:
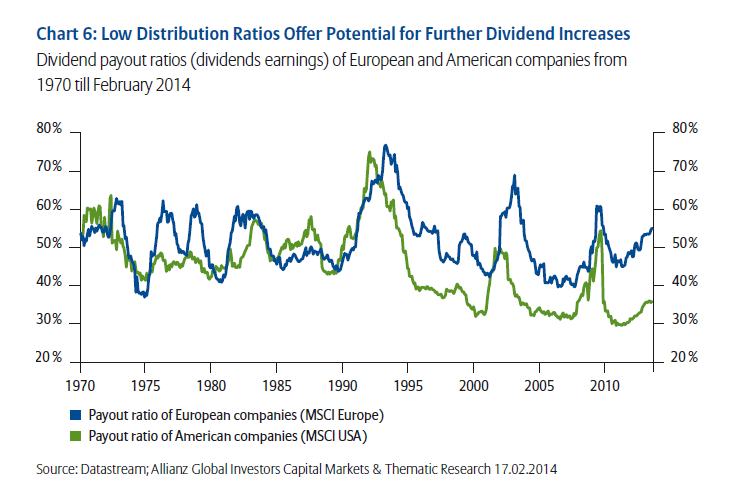
As earnings blossomed following the 2008 / 2009 financial crisis, the distribution ratios of companies have declined considerably. In Europe, the ratio of paid dividends to earnings per share is currently around 55 %, which is moderate by historical comparison. In the US, it is close to its lowest levels ever, at about 35% (see Chart 6).There is thus scope for dividend hikes.
Source: Dividend strategies in times of financial repression, Allianz Global Investors