The Global Top Oil and Gas Companies by Market Capitalization

The oil and gas industry is the one of the most important industries in many countries. The economies of Middle Eastern countries are based oil and natural gas. It is also the largest sector of the Russian economy. As a commodity, crude oil prices are volatile and fluctuate based on an infinite number of reasons ranging from political to supply and demand. For example, a bunch of rag tag rebels in Nigeria setting fire to a pipeline can cause the global price of oil to shoot up. If wars, rebels and other factors do not inflate the price of oil then the OPEC cartel has the power to adjust the production and supply there by leading to higher prices.

In recent weeks crude oil prices have actually fallen. From over $100 a barrel oil prices (WTI) has plunged and closed last Friday at $91.13 on the NYMEX. As falling prices dings the revenues of the cartel members. OPEC has indicated that it would intervene if prices fall below $85 per barrel.If oil price falls below that set level, then OPEC will manipulate the production levels to prop up the price back to above $85.

From an investment standpoint, large-cap oil and gas companies offer many advantages such long-term growth, stable and decent dividend yields,  higher earnings when oil prices rise, etc. Hence investors can consider allocating a portion of their portfolios to oil and gas stocks.

The following 14 global oil and gas giants appeared in the Global Top 100 Companies by Market Capitalization report published by PricewaterhouseCoopers earlier this year. Investors looking to gain exposure to this industry can consider adding these companies in  a phased manner.

1.Company: Exxon Mobil Corp (XOM)
Current Dividend Yield: 2.88%
Country: USA

2.Company: Royal Dutch Shell PLC (RDS.A)
Current Dividend Yield: 4.22%
Country: UK

3.Company: PetroChina Co Ltd (PTR)
Current Dividend Yield: 3.46%
Country: China

4.Company: Chevron Corp (CVX)
Current Dividend Yield: 3.49%
Country: USA

5.Company: BP PLC (BP)
Current Dividend Yield: 5.09%
Country: UK

6.Company: Total SA (TOT)
Current Dividend Yield: 5.34%
Country: France

7.Company: Schlumberger NV (SLB)
Current Dividend Yield: 1.57%
Country: USA

8.Company: Sinopec Corp (SNP)
Current Dividend Yield: 3.50%
Country: China

9.Company: Gazprom OAO (OGZPY)
Current Dividend Yield: 5.43%
Country: Russia

10.Company: Petrobras SA (PBR)
Current Dividend Yield: 2.96%
Country: Brazil

11.Company: Eni SpA (E)
Current Dividend Yield: 4.71%
Country: Italy

12.Company: Statoil ASA (STO)
Current Dividend Yield: 4.22%
Country: Norway

13.Company: Ecopetrol SA (EC)
Current Dividend Yield: 6.92%
Country: Colombia

14.Company: ConocoPhillips (COP)
Current Dividend Yield: 3.72%
Country: USA

Note: Dividend yields noted above are as of Sept 12, 2014. Data is known to be accurate from sources used.Please use your own due diligence before making any investment decisions.

Disclosure: Long PBR
A Note on Currency Risk in International Equity Investments

Investing in foreign stocks involves many risks one of which is currency risk. While most currencies of developed countries remain stable  in relation to the US dollar there is still the risk that currency exchange movements can reduce returns earned from equities. Unlike emerging or frontier markets investors in developed countries need not worry about dramatic devaluation almost overnight or other extreme scenarios.

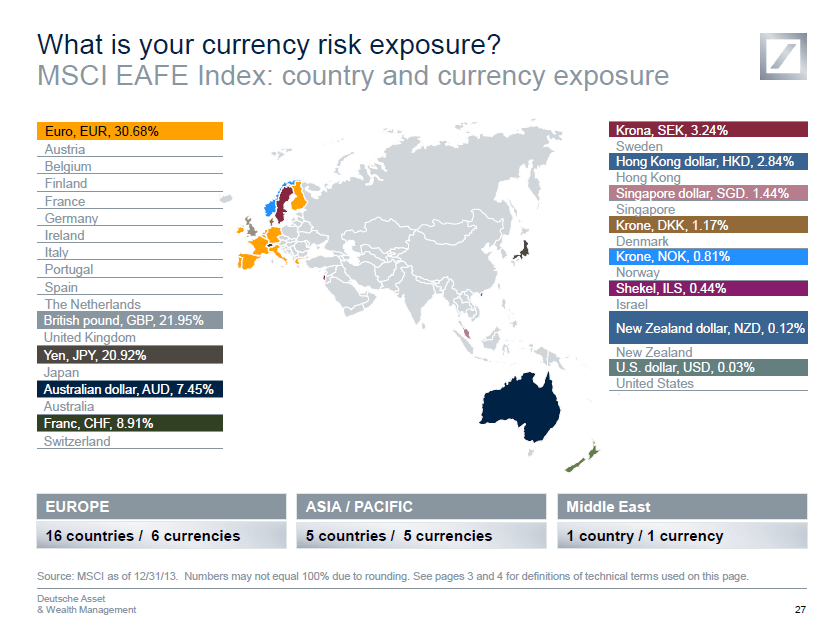
Lets review the impact of currency risks using the MSCI EAFE Index which measures the performance of developed equities outside of the U.S. and Canada. The iShares MSCI EAFE Index (EFA) ETF tracks the performance of this index and has net assets of over $54.0 billion. It is one of the largest ETFs out there in terms of assets as it provides a simply way to access developed markets outside of U.S. and Canada.Investors in this ETF and other funds that track the index will be exposed to many currencies such as the Swedish Krona, Japanese Yen,  Euro, Australian dollar, etc. For the 22 countries in the index investors will be exposed to 12 different currencies risks as shown in the graphic below:

Click to enlarge

MSCI Currency Exposure by Country

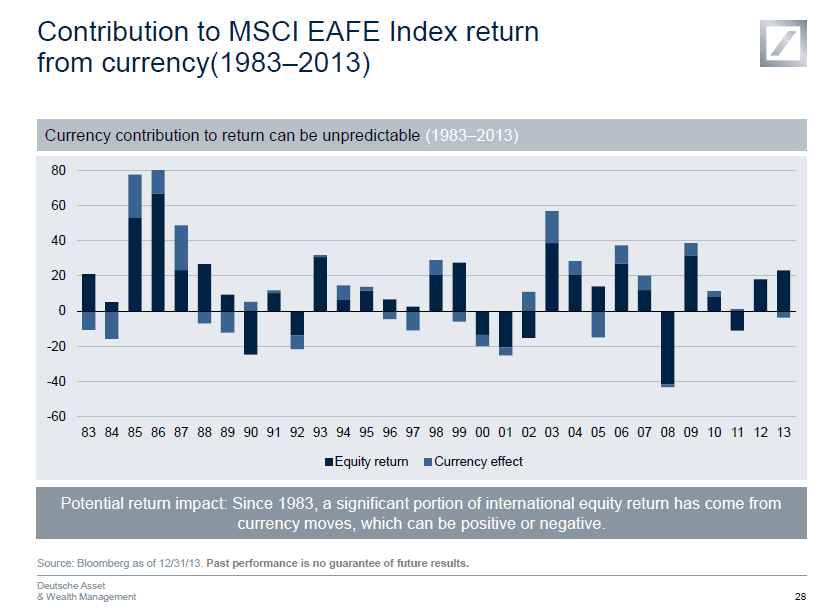
Currency exchange movements affect the total return on an investment in foreign equities. In some years this impact can be significant when compare to equity returns. The following chart shows the contribution of currency effects to the MSCI EAFE Index by year from 1983 to 2013:

Contribution of Currency Effects to MSCi EAFE Returns 1983 to 2013


Source:  Managing risk factors to build a better portfolio, Deutsche Asset & Wealth Management

Related ETFs:

  • Vanguard MSCI EAFE ETF (VEA)
  • iShares MSCI EAFE Index (EFA)

Disclosure: No Positions

Test:

RIA NovostiThe History of the Atomic Bomb Project

13:35 29/08/2014 The first Soviet nuclear warhead was tested on August 29, 1949.>>

A Review of the Performance of Brazilian Exchange-listed ADRs Year-To-Date

The Brazilian equity market has been very volatile in the past few weeks due to the upcoming general elections in October. Brazil used to be the top destination for emerging market investors up until a few years ago. Equity investors enjoyed spectacular returns when the Brazilian market as hot. For example, from 2001 to 2010 the 10-year annualized return for Brazil was 21.6%. Though Brazil plunged over 56% during the peak of the global financial crisis in 2008, the following year it soared by 128%. From 2003 to 2007, Brazilian stocks yielded double digit percentage returns. However as the global commodity market cooled in the past few years and government policies became anti-investor friendly, global investors fled Brazilian equities.

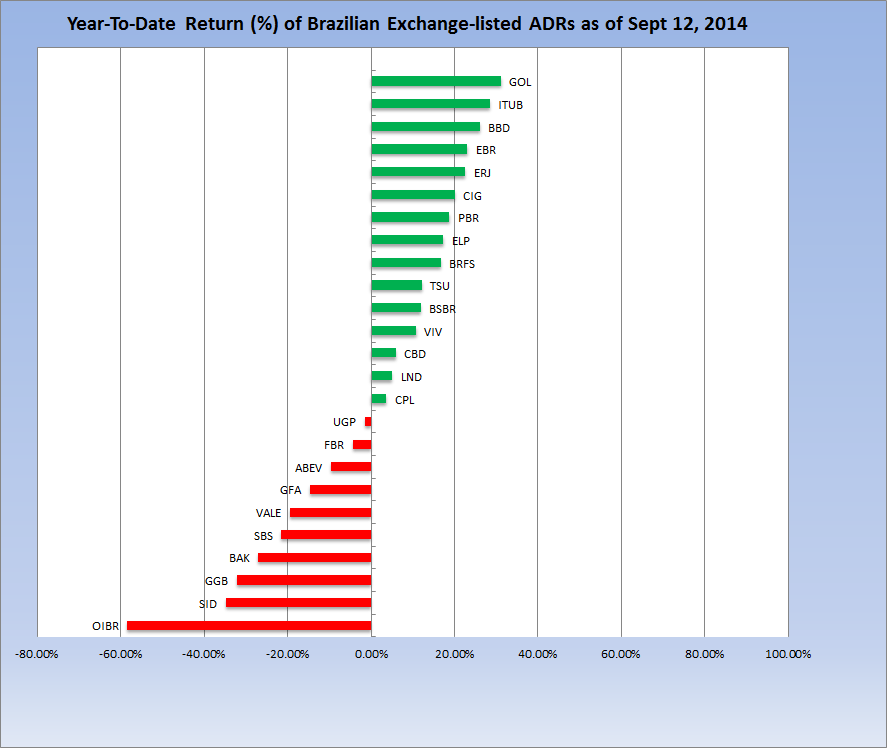
The Bovespa is up by 10.5% so far this year as investors bet on a change in political reforms and policies. Though most Brazilian ADRs fell on Friday, year-to-date some of the ADRs are in the positive territory as shown in the chart below:

Click to enlarge

Brazilian ADRs Return YTD

Data Source: BNY Mellon

Miners and some utilities such as Sabesp (SBS) are down year-to-date while banks such as Itau (ITUB), Banco Bradesco (BBD) are up by over 20%. Though Petrobras (PBR) is up this year, it still has a long way to go to reach the highs reached in the recent past. It would be interesting to how the equity market reacts once the elections are over and a new administration takes power.

Disclosure: Long PBR, BBD, ITUB

The Top 50 Global Pharma Companies 2014

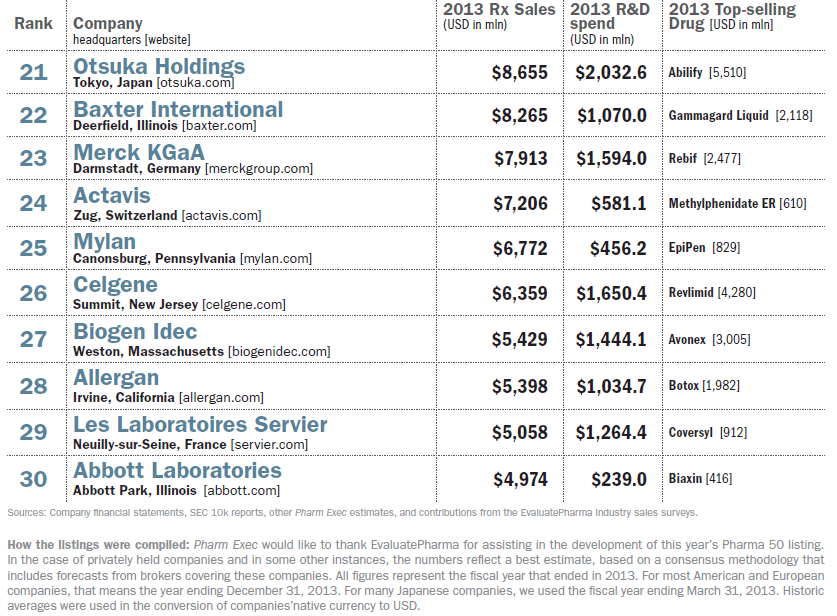
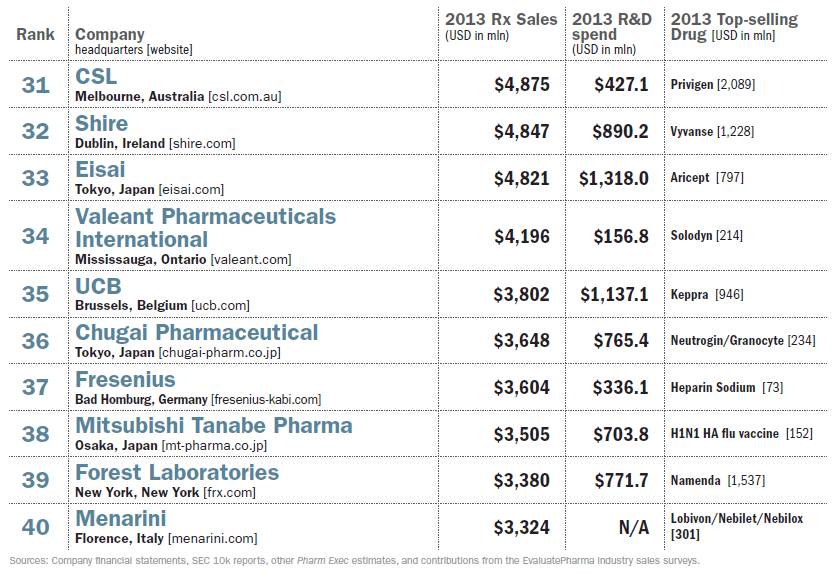
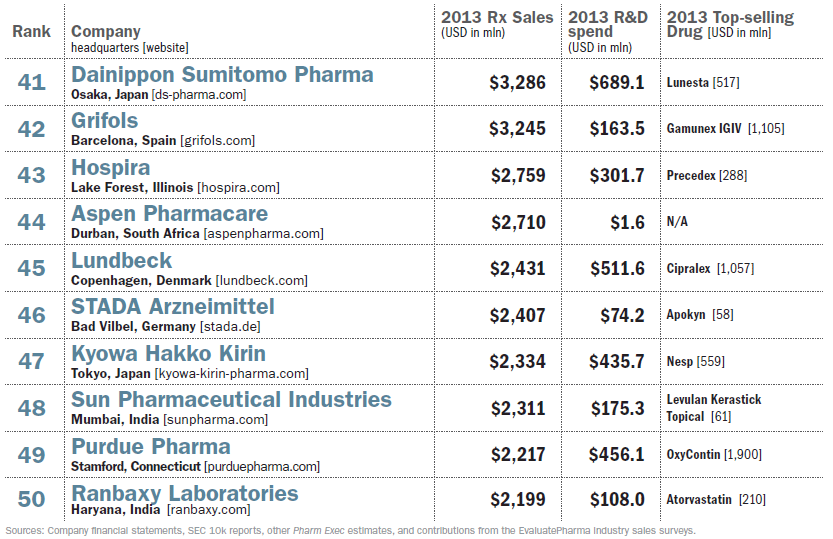
The Pharmaceutical Executive magazine publishes its annual ranking of the Top 50 Pharma Companies Worldwide based on sales in the previous year. This year’s list was released back in June.

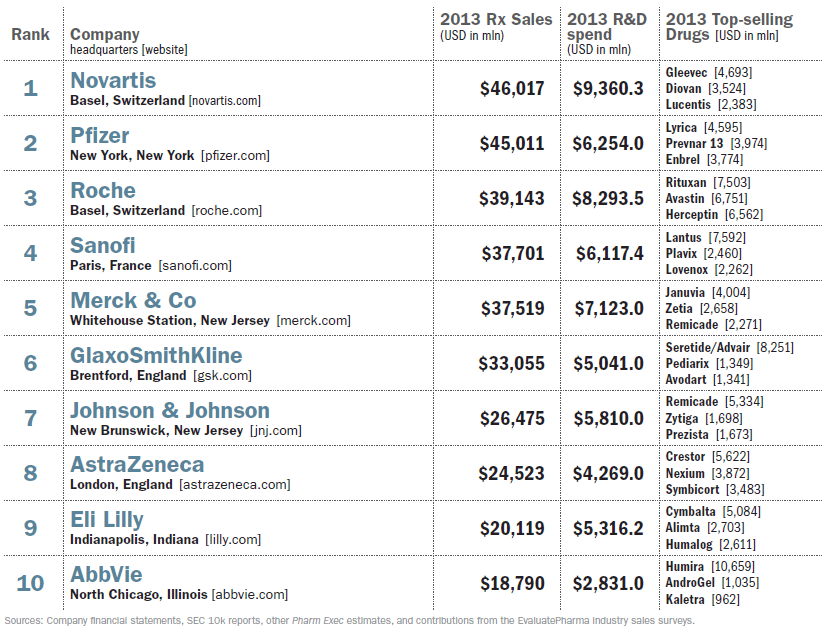
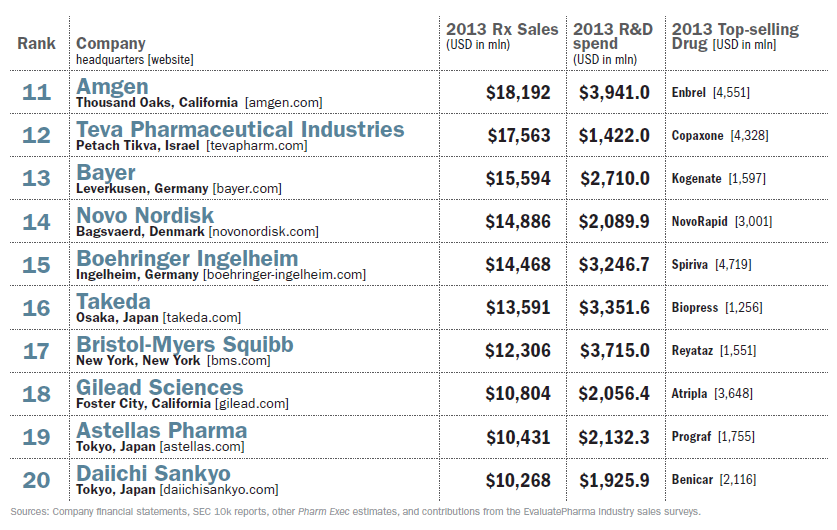
The Top 50 Global Pharma Companies are listed in the tables below:

Click to enlarge

Top 50 Pharma Cos 2014 - Page 1

Top 50 Pharma Cos 2014 - Page 2

Top 50 Pharma Cos 2014 - Page 3


Top 50 Pharma Cos 2014 - Page 4 Top 50 Pharma Cos 2014 - Page 5

Source: Pharmaceutical Executive

Here are a few observations:

  • Swiss drug giant Novartis(NVS) replaced last year’s topper Pfizer (PFE).  Novartis beats Pfizer in R&D expenditure as well.
  • The top 10 firms are either from the U.S. or developed Europe.
  • It is not surprising to see Israeli generic drug maker Teva(TEVA) on the 12th place since generics are becoming more popular among cost-conscious consumers.
  • Denmark-based Novo Nordisk(NVO) is the world leading drug and equipment maker for diabetes. Hence the company has strong growth potential in emerging countries such as China where diabetes is becoming more prevalent as people’s food habits change.

For the 2013 ranking of the Top 50 Pharma firms click here.

Also checkout:

Disclosure: No Positions

Chart: Brazil’s Bovespa Index

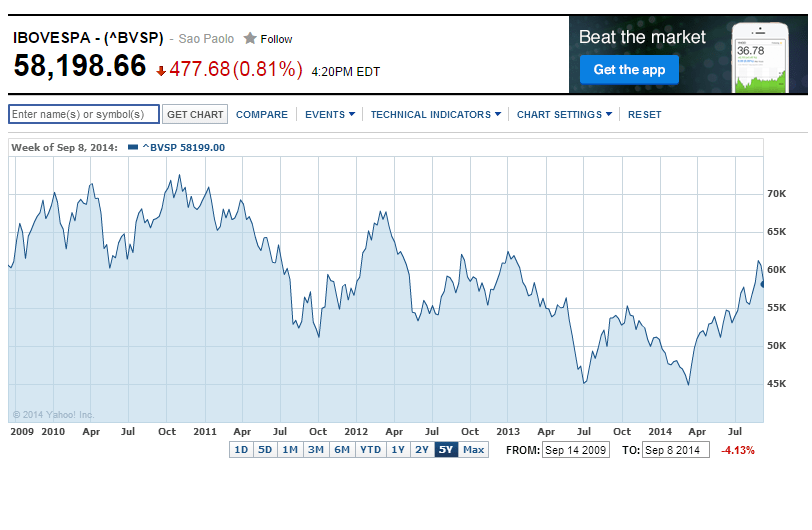
The Brazilian equity market as measured by Bovespa is up 13.0% this year due to elections.However in the past 5 years Brazil has been a laggard with the Bovespa actually down by over 4% as shown below:

Click to enlarge

Bovespa 5 years

Source: Yahoo Finance

From 1993 the index has soared by an astonishing 241,389% according to Yahoo data. It remains to be seen if Brazilian stocks can pick up their mojo  after the elections.

Related ETF:

  • iShares MSCI Brazil Index (EWZ)

Disclosure: No Positions