Crude oil and natural gas are two of the largest natural resource exports of Russia. As crude oil prices have plunged bt over 40% in the past few months Russia’s economy is adversely impacted.
The graphic below shows the importance of energy to the Russian economy:
Click to enlarge
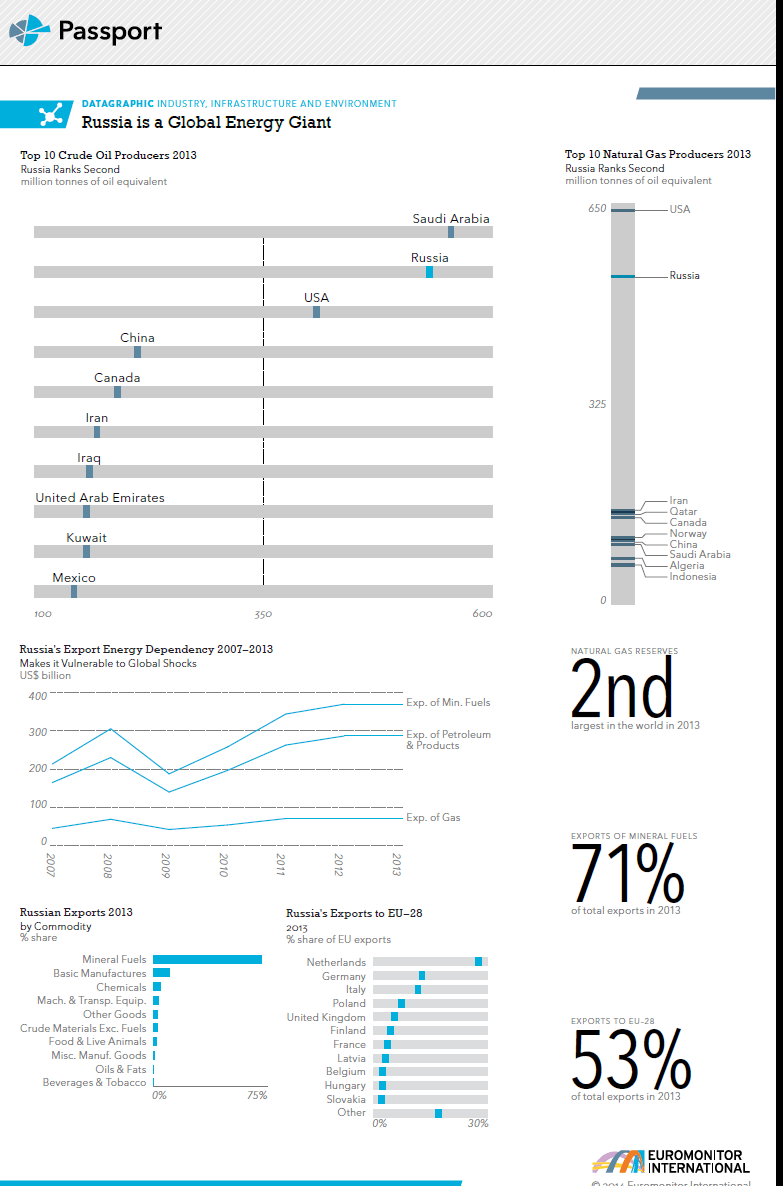
Source: Euromonitor