The production of Crude Oil in the U.S. continues to rise. The explosive growth in the exploration of oil by fracking and other factors have contributed to a resurgence of the country as a major oil producer.
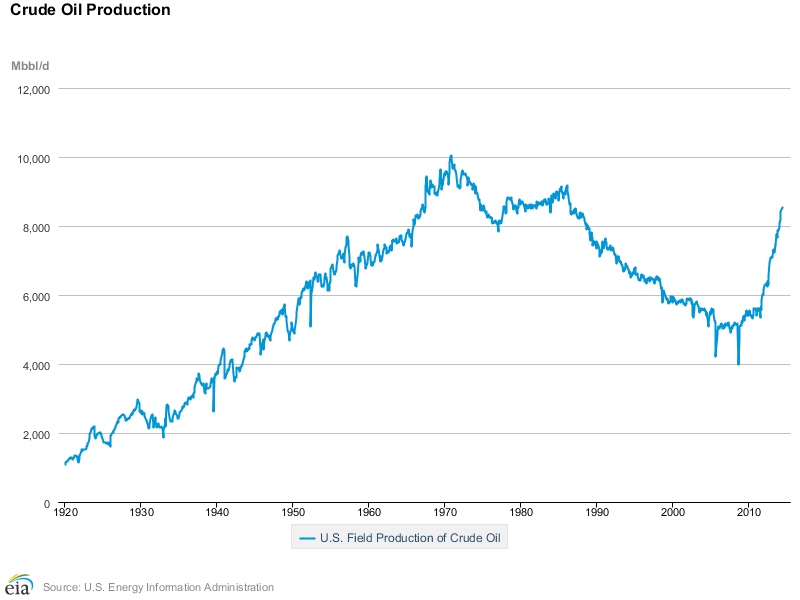
U.S. crude oil production continuously rose from 1920 and reached its peak in 1970. After a stead decline from that time, production has regained momentum and has followed an upward trend since mid-2008 as shown in the chart below:
Click to enlarge
Source: U.S. Energy Information Administration
Note: The figures shown above are daily production figures.
In July of this year crude oil production totaled 8,537 Thousand Barrels per Day.
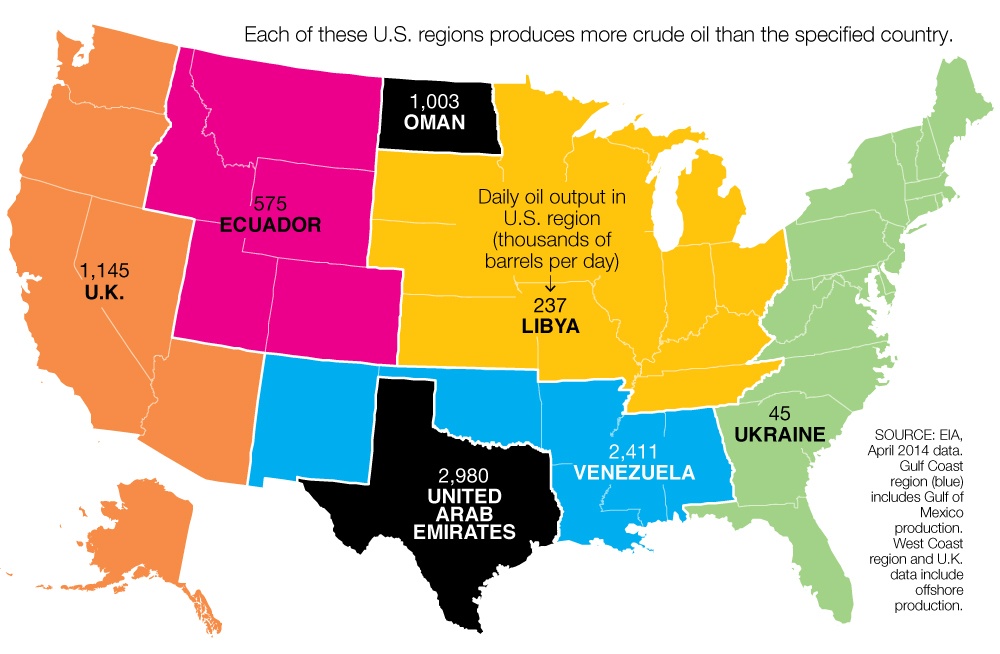
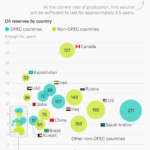
How does the US oil production compare to certain oil producing countries?
The map below shows the answer to the above question.
Click to enlarge
Via Malaysia-Finance
It is interesting that Texas produces more oil than UAE.
Related ETN:
- iPath S&P GSCI Crude Oil TR ETN (USO)
Disclosure: No Positions
