I came across an interesting article titled Stampede to the International Market by Edward Friedman, Senior Research Analyst at McLean&Partners of Canada. In the article Mr.Friedman discussed the importance of diversification for Canadian investors. The following post is based on that article.
The S&P/TSX Composite Index has lagged the performance of the S&P 500 this year. While the S&P 500 is up by 12.6% as of Dec 22, the TSX Composite is up by only 7.1%. Canadian stocks have under-performed their American peers in the past few years.As the chart shows below, the TSX Composite diverged strongly from the S&P 500 since mid-2011. In the past five years, the S&P 500 is about 89% compared to just 22% for the TSX Composite.
Click to enlarge
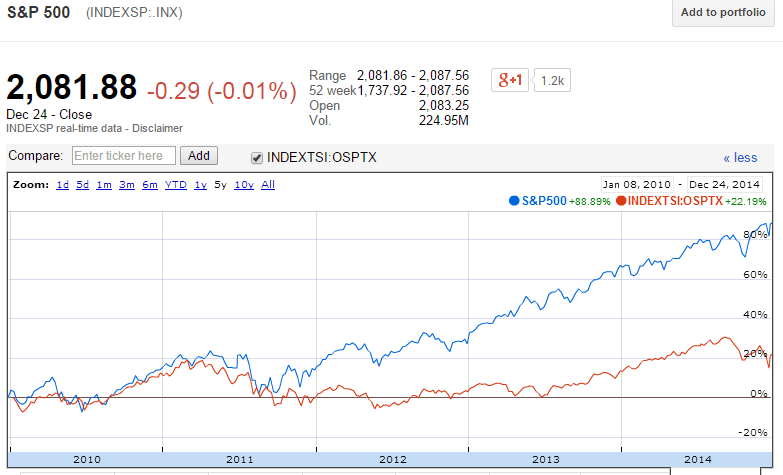
Source: Google Finance
Why did Canadian stocks lag the performance of U.S. stocks?
The answer to the above question is due to the over-reliance of the Canadian economy on the energy sector. As the prices of crude oil and other commodities declined in the past few years Canadian firms got hit hard which in turn led to the crash in their share prices.
The TSX Composite is highly concentrated with just energy and financial sectors accounting for about 58% of the index. On the other hand, these two sectors contribute only about 25% to the S&P 500 with energy accounting for 8.4%. The composition of the S&P 500 index is is much more diversified than the TSX.
| Sector | S&P/TSX Composite Index | S&P 500 Index |
|---|---|---|
| Consumer Discretionary | 6.4% | 12.0% |
| Consumer Staples | 3.4% | 9.9% |
| Energy | 21.6% | 8.4% |
| Financials | 36.7% | 16.3% |
| Health Care | 3.6% | 14.3% |
| Industrials | 8.7% | 10.4% |
| Information Technology | 2.1% | 20.0% |
| Materials | 10.4% | 3.2% |
| Telecom Services | 4.9% | 2.4% |
| Utilities | 2.2% | 3.1% |
| Total | 100.0% | 100.0% |
Source: Standard&Poor’s
The following chart shows the concentration of the S&P/TSX Composite Index:
Click to enlarge
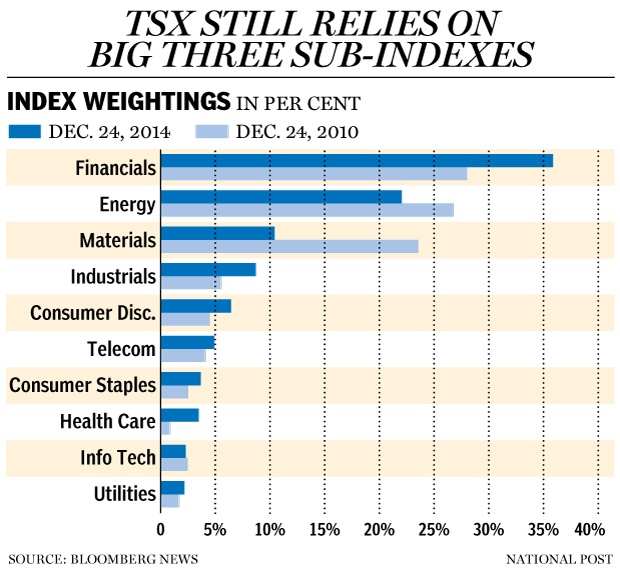
Source: Why it’s time for investors to move out of Canada — and stay out, Dec 27, 2014, Financial Post
The above discussion shows how very high concentration of few sectors in a country’s economy will adversely impact the return of equities when those sectors suffer. In the Canadian context, the decline in crude oil prices is one major factor. Hence investors must take into account concentration risks and build their portfolios accordingly when selecting stocks for investment in other countries.
Related ETFs:
Disclosure: No Positions
TEST: