Monopoly Madness in the U.S. Cable TV Industry

The U.S. economy is officially considered a free-market economy. However in reality, many sectors of the economy are dominated by a handful of monopolies and oligopolies. For example, the tax preparation industry is dominated major players like TurboTax (owned by Intuit), H&R Block and TaxAct. 

The U.S. is one of the few countries in the world that have laws in place to prevent companies from monopolizing the market. The Sherman Antitrust Act was enacted in 1890 for this purpose.It has been used many times since then to breakup monopolies. However in the 20th and 21st centuries breaking up monopolies has become harder even with this law on the books.

Here is a short quote on The Sherman Antitrust Act from Wikipedia:

The Sherman Antitrust Act (Sherman Act,[1] 26 Stat. 209, 15 U.S.C. §§ 17) is a landmark federal statute in the history of United States antitrust law (or “competition law“) passed by Congress in 1890. It prohibits certain business activities that federal government regulators deem to be anti-competitive, and requires the federal government to investigate and pursue trusts.

It has since, more broadly, been used to oppose the combination of entities that could potentially harm competition, such as monopolies orcartels.

According to its authors, it was not intended to impact market gains obtained by honest means, by benefiting the consumers more than the competitors. Senator George Hoar of Massachusetts, another author of the Sherman act, said the following:

“… [a person] who merely by superior skill and intelligence…got the whole business because nobody could do it as well as he could was not a monopolist..(but was if) it involved something like the use of means which made it impossible for other persons to engage in fair competition.”[2]

The Act’s reference to “trusts”, and to “antitrust” law in general, is sometimes misunderstood by modern readers. In 19th century America, the term “trust” was synonymous with monopolistic practice, because the trust was a popular way for monopolists to hold their businesses, and a way for cartel participants to create enforceable agreements.[3] In most countries outside the United States, antitrust law is known as “competition law“, instead.

Source: Wikipedia

I have written about the monopolistic nature of the U.S. Airline and Railroad Industries before. Along the similar lines this post is related to the Cable TV industry. Just like so many other industries, just four big companies control the majority of the cable TV market in the U.S. As a result, they are able to dictate prices in the markets they control and customers are forced to endure atrocious customer service.

In Feb 2014, Comcast(CCV), one of the biggest cable companies announced plans to buy Time Warner Cable(TWC) for $45 billion. The deal has to be approved by the FCC and the U.S. Department of Justice. Time Warner had about 11 million subscribers and Comcast had about 33 million subscribers last year. So the combined company, if the deal is approved, will be able to control a substantial share of the cable TV market.

The graphic below shows the evolution of the four major cable companies:

Click to enlarge

US Cable TV Industry

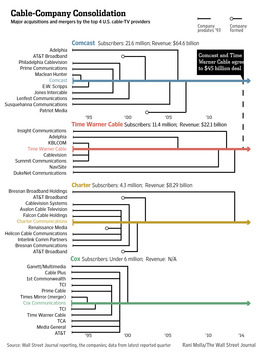
Source: Cable Company Got Its Price, With Tradeoffs, Feb 13, 2014, The Wall Street Journal

Disclosure: No Positions

A Review of Frontier Markets Investing

Frontier markets are markets that are considered less developed than emerging markets. These markets include countries such as Sri Lanka, Ghana, Ukraine, etc. Of the 33 countries that MSCI classifies as frontier markets 24 are included in the MSCI Frontier Markets Index.

The major index provider classifies the following markets as Frontier markets:

Click to enlarge

MSCI Frontie Markets Countries

These equity markets are very tiny compared to global markets and they are not suitable for all investors. Stocks in these markets are very illiquid, information on them are hard to find, can be very volatile, etc.

In terms of performance, the MSCI Frontier Markets index has outperformed the MSCI Emerging Markets index in the past five years. However it has lagged the returns of the indices for Developed markets of North America and Europe as the chart shows below:

Click to enlarge
MSCI Frontier Markets Index Returns 5 Years


Source: MSCI

This shows that frontier markets investing returns is not much better than emerging markets in terms of performance. Of course, they are nowhere near the performance of developed markets. Global investors prefer developed markets and they command a premium over frontier and emerging markets. For example, one cannot even compare the FTSE index and the liquidity of stocks on the London Stock Exchange to a frontier market like Morocco or Jamaica.

Investors willing to take huge risks can allocate a tiny portion of their portfolio to frontier markets. Since investing in individual stocks are difficult one way to easily invest in these markets is via the iShares MSCI Frontier 100 ETF (FM). The ETF tracks the performance of the 100 of the largest frontier market stocks represented in the MSCI Frontier Markets 100 Index. Hence it has 100 holdings and is the largest of the frontier market ETFs with an asset base of over $569 million. The fund was started in late 2012 and has a distribution yield of 1.05%.

With a portfolio weightage of over 26%, the fund is highly concentrated with stocks from Kuwait. Argentina and Pakistan together with Kuwait account for over 50% of the portfolio allocations. Year-to-date the ETF is down by 2.34%.

MorningStar published an research report “Frontier Markets Begin To Emerge” in December, 2014. Investors interested in these markets may want to read the report in full which can be found here(in pdf).

Update:

Frontier MArkets

Source: A ‘Frontier’ Markets Survival Guide, Feb 8, 2015, The WSJ

Disclosure: No Positions

Update:

Size of Frontier Markets

Size of Frontier Markets


Source: Frontier Markets: Concentrated And Misunderstood, Feb 3, 2015, Financial Advisor

NYSE-listed Foreign Firms with Large Market Capitalizations

Apple Inc(AAPL) became the most valuable company in the world this Monday when its market cap exceed $710.0 billion. The next largest firms have market caps of less than $400 billion as the graphic shows below:

Click to enlarge

Apple Market Cap

Source: Apple: $710 Billion and Counting, Feb 10, 2015, The Wall Street Journal

I was curious about the size of the large-cap foreign firms trading on the New York Stock Exchange. According to the latest data, drug giant Novartis(NVS) has the highest market cap at over $276 billion. The table below shows the list of foreign firms on the NYSE which have market capitalization of over $50 billion:

S.No.CompanyTickerMarket Capitalization (as of Feb 12, 2015)IndustryDividend Yield (as of Feb 12, 2015)
1 China Mobile Ltd.CHL $269.2B Wireless Telecommunication Services 3.05%
2 Novartis AGNVS $276.1B Pharmaceuticals 2.70%
3 Alibaba Group Holding LtdBABA $213.9B Internet & Catalog Retail --
4 Toyota Motor CorpTM $220.8B Automobiles 2.46%
5 Anheuser Busch Inbev SABUD $195.9B Beverages 2.67%
6 HSBC Holdings plcHSBC $173.6B Banks 5.39%
7 Sanofi SASNY $127.7B Pharmaceuticals 3.97%
8 Royal Dutch Shell plcRDS.A $211.2B Oil, Gas & Consumable Fuels 5.82%
9 Taiwan Semiconductor Mfg. Co. Ltd.TSM $121.6B Semiconductors & Semiconductor Equipment 2.06%
10 BP plcBP $124.0B Oil, Gas & Consumable Fuels 5.95%
11 Total SATOT $126.4B Oil, Gas & Consumable Fuels 5.70%
12 GlaxoSmithKline plcGSK $112.3B Pharmaceuticals 5.62%
13 Banco Santander, S.A. SAN $95.2B Banks 11.91%
14 Westpac Banking CorpWBK $88.7B Banks 5.59%
15 Novo Nordisk A/SNVO $90.3B Pharmaceuticals 1.79%
16 AstraZeneca plcAZN $86.5B Pharmaceuticals 4.09%
17 SAP SESAP $82.3B Software 2.04%
18 Mitsubishi UFJ Financial Group IncMTU $81.1B Banks 4.00%
19 Lloyds Banking Group PLCLYG $81.0B Banks --
20 BHP Billiton LimitedBHP $124.7B Metals & Mining 5.05%
21 Diageo plcDEO $72.3B Beverages 2.92%
22 Telefonica S.A.TEF $68.3B Diversified Telecommunication Services 5.99%
23 NTT Docomo IncDCM $74.9B Wireless Telecommunication Services 4.89%
24 Rio Tinto plcRIO $84.3B Metals & Mining 4.42%
25 Nippon Telegraph & Telephone CorpNTT $69.0B Diversified Telecommunication Services 2.73%
26 Barclays PLCBCS $63.2B Banks 3.20%
27 Eni SpAE $62.1B Oil, Gas & Consumable Fuels 8.53%
28 Prudential Public Limited CompanyPUK $63.1B Insurance 3.00%
29 CNOOC LtdCEO $62.3B Oil, Gas & Consumable Fuels 5.28%
30 Statoil ASASTO $59.3B Oil, Gas & Consumable Fuels 9.34%
31 Honda Motor Co LtdHMC $57.8B Automobiles 2.52%
32 Banco Bilbao Vizcaya Argentaria SABBVA $56.6B Banks 5.91%
33 BT Group plcBT $57.1B Diversified Telecommunication Services 2.57%
34 Unilever plcUL $127.6B Food Products 3.43%
35 Teva Pharmaceutical Industries LtdTEVA $54.9B Pharmaceuticals 2.37%
36 Unilever N.V.UN $127.6B Food Products 3.49%
37 ING Groep NVING $50.7B Diversified Financial Services --
38 China Telecom Corporation LimitedCHA $50.4B Diversified Telecommunication Services 1.95%
39 National Grid plcNGG $51.4B Multi-Utilities 5.08%

Note: ING resumed paying dividends after a break of many years and will pay 12 Euro cents this year.

Just a handful of firms have market caps exceeding $200 billion and most firms have market caps under $100 billion. Many of the oil firms listed here have lost substantial market values in the past few months. Others like Petrobras(PBR) of Brazil do not even appear in this list as it is valued at under $25 billion now.

Disclosure: Long LYG, PBR, ING

Ten Under-the-Radar Foreign Stocks Worth Investing In

When it comes to investing in foreign stocks there are hundreds of companies that trade on the US markets.Some of them are popular and widely followed. For example, companies such as oil giant Total (TOT), banking group Barclays(BCS), Vodafone (VOD), Siemens(SIEGY), Nestle(NSRGY),  etc. are widely followed with thousands of shares changing hands everyday. However there are also many high quality firms whose stocks are not popular and they fly under the radar. In this post, let me list such stocks. Though they are less followed, these stocks offer great growth potential and attractive dividend yields. Investors willing to diversify their portfolio can expand their horizon by considering these stocks.

1.Company: Autoliv Inc (ALV)
Current Dividend Yield: 1.91%
Sector: Auto Parts
Country: Sweden

2.Company: Copa Holdings SA (CPA)
Current Dividend Yield: 3.46%
Sector: Airline
Country: Panama

3.Company: Novozymes A/S (NVZMY)
Current Dividend Yield: 0.99%
Sector: Drugs
Country: Denmark

4.Company:Air Liquide (AIQUY)
Current Dividend Yield: 2.46%
Sector: Chemicals
Country: France

5.Company: Fresenius Medical Care AG & Co (FMS)
Current Dividend Yield: 1.44%
Sector: Health Care Providers & Services
Country: Germany

6.Company: Fomento Economico Mexicano SAB de CV (FMX)
Current Dividend Yield: 3.54%
Sector: Beverages (Nonalcoholic)
Country: Mexico

7.Company: Cathay Pacific Airways (CPCAY)
Current Dividend Yield: 1.53%
Sector: Airline
Country: Hong Kong

8.Company: Coca-Cola Amatil (CCLAY)
Current Dividend Yield: 6.08%
Sector: Beverages (Nonalcoholic)
Country: Australia

9.Company: Delhaize (DEG)
Current Dividend Yield: 2.48%
Sector: Food &Drug Retailers
Country: Belgium

10.Company: Swedish Match AB (SWMAY)
Current Dividend Yield: 3.49%
Sector: Tobacco
Country: Sweden

Note: Dividend yields noted above are as of Feb 11, 2015. Data is known to be accurate from sources used.Please use your own due diligence before making any investment decisions.

Disclosure: No Positions

Click to enlarge

NYSE

The New York Stock Exchange, NY

Greek Sovereign Debt Owed by Creditor

The Greek debt drama is taking center stage again in recent weeks. A few years ago it appeared that the Greek story was dead once and for all. Alas. That did not happen.Every few years the tiny poorest country in developed Europe appears to rear its ugly head again on the international arena. It is sad that the small country with an insignificant economy on the global level becomes the source for triggering a crisis again and again. Hopefully the current new regime will find a permanent solution and lead the country get back on its feet.

Greece owes billions in debt to creditors. The following chart shows the total debt owed and the creditors:

Click to enlarge

Greek Debts Total

The chart below shows the debt re-payment schedule:

Click to enlarge

Greek Debts Payback Scheduele


Source: Athens vs. Brussels: Greece Inches Closer to Renewal of Debt Crisis, Feb 10, 2015, Der Spiegel

Update:

Click to enlarge

FT-chart-greek-debt-service

Source: Financial Times

Who Owes Greece

Source: BBC

Greece Debt

Source: Protherma

greece_debt_Telegraph


Source: Three myths about Greece’s enormous debt mountain, Jan 28, 2015, The Telegraph

Also checkout: