In many emerging markets, State-Owned Enterprises (SOEs) account for a huge portion of the country’s economy. These giant firms are majority owned by the state and employ millions of workers. These publicly-listed companies dominate the local equity markets in terms of market capitalization.
Since they are owned by the government, these companies are high political interference in their operations. For example, top positions in the firms may be given to cronies of influential politicians.
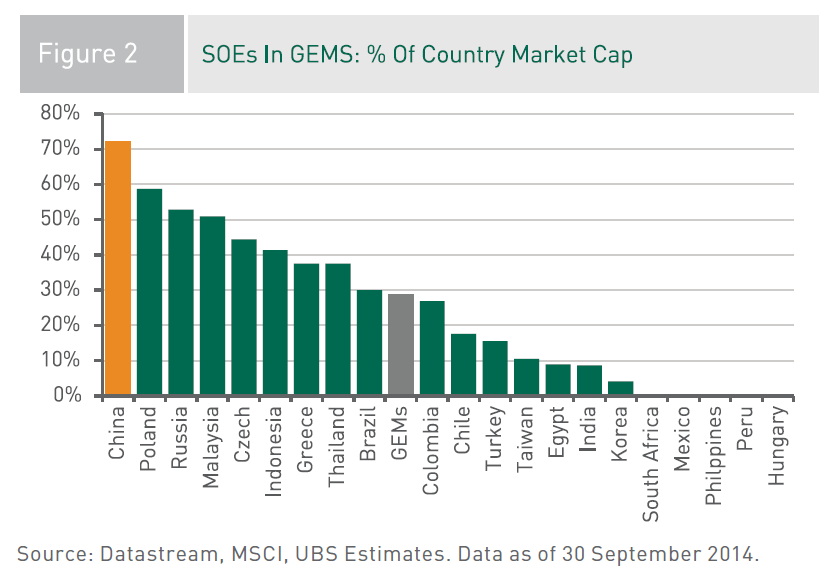
Click to enlarge
Source: Xi-conomics – “A Bold And Sustainable State-Owned Enterprise Reform”, Pinebridge Investments
Some of the publicly-listed SOEs tend to be inefficient and some are even unprofitable.Despite lack of profits SOEs continue to be kept alive by the states for a variety of reasons such as using them as a conduit to loot public funds, keeping workers employed in order to secure their votes in elections, etc.
In China, SOEs accounted for a staggering 72% of the MSCI China market cap in November 2014. None of the other emerging markets had such a high concentration of SOEs in their domestic equity markets. China listed its first SOE on the Hong Kong Exchange in 1993. Two examples of Chinese SOEs are China National Offshore Oil Corporation or CNOOC (CEO) and Petrochina(PTR). With a market cap of over $212 billion PetroChina is huge compared to other major global players in the industry.
Brazilian oil giant Petrobras (PBR) is an example of a Brazilian SOE.Unlike Petrochina or CNOOC, Petrobras has been a victim of many of the problems I noted above with respect to SOEs. Corruption, fraud and other activities in the companies has forced investors to flee the stock. Currently once high-flying PBR goes for under $7.00 a share.
All of the major Russian oil firms such as Lukoil(LUKOY), Rosneft(OJSCY), Gazprom(OGZPY) are owned by the government. Similarly Petronas, the global oil major is the jewel of the Malaysian government.
Disclosure: Long PBR
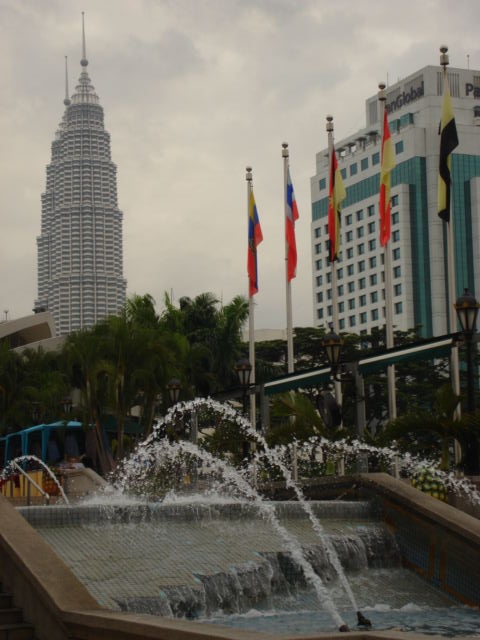
Petronas Towers, KL, Malaysia