- Executive Pay Gluttony (Barry) (Gluttony is a sin. So.. 🙂 )
- Bubble risk grows as China’s stock boom defies gravity (Business Line)
- Vietnam War 40 Years Later: Capitalism Trumps Ideology (Common Dreams) See also 30 April 1975: North Vietnamese forces capture Saigon (MoneyWeek)
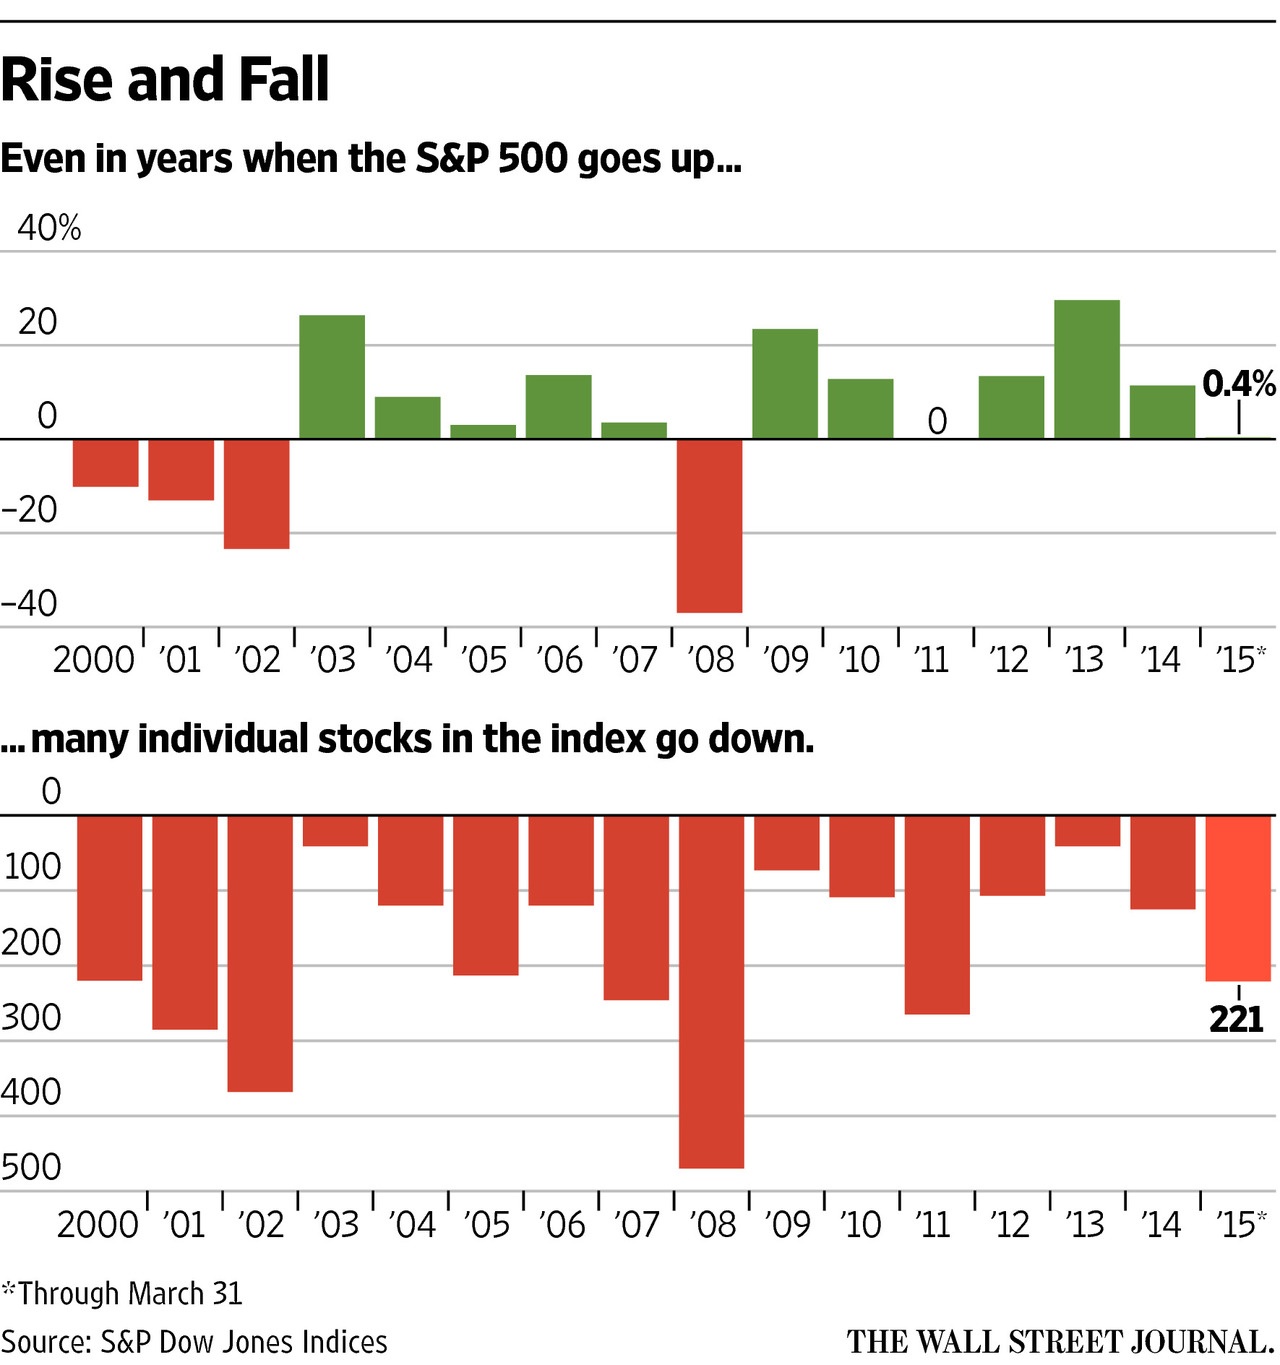
- The Day Wall Street Changed (Jason Zweig, WSJ)
- Stick with the Winners (The Financilist)
- Opinion: Five reasons why Greece won’t exit the euro (DW)
- Why Mother India heads emerging market pack (Money Observer)
- Is long-term earnings inequality growing? Evidence from German baby-boomers and their parents (OECD Observer)
- Seven years on, RBS has yet to escape the grim shadows of the past (The Telegraph)… Still they call it “Royal” Bank of Scotland..