- Ashmore: This hated market’s bounce-back isn’t over yet (FE Trustnet)
- Perfect Nails, Poisoned Workers (NYTimes)...yet another article on labor exploitation
- 15 years of Vladimir Putin: 15 ways he has changed Russia and the world (The Guardian)
- Have profits peaked? (Fidelity) Also see Why Corporate Profits Are Falling and What It Means for the Stock Market (Schwab)
- Against the tide: Greece – the joker in the pack (Euromoney) Also see Greece debt: What’s it like to live under threat of default? (BBC)
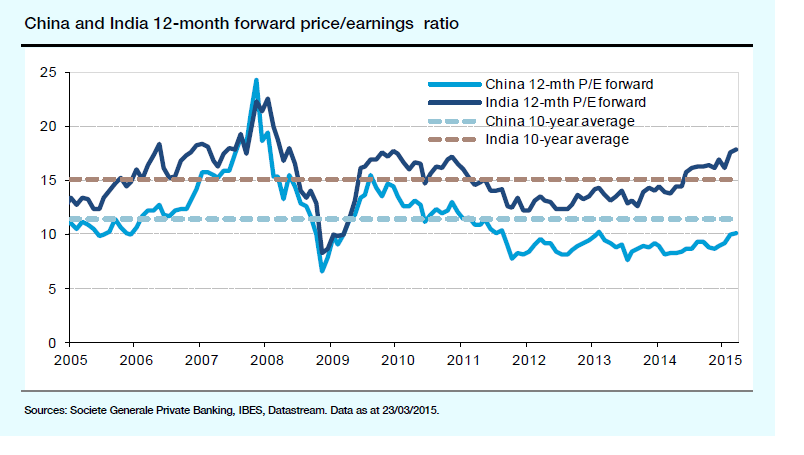
- China: ‘Challenging the bears’ (Invesco Perpetual, UK)
- Bacteria to the rescue (OECD Observer)
- The Dead Money Syndrome (Canadian Investment Review)
- Emerging-Market Opportunities: Look Under the Surface (AB Blog)
- Where Dividend Investors are Seeking Income (Blackrock Blog)

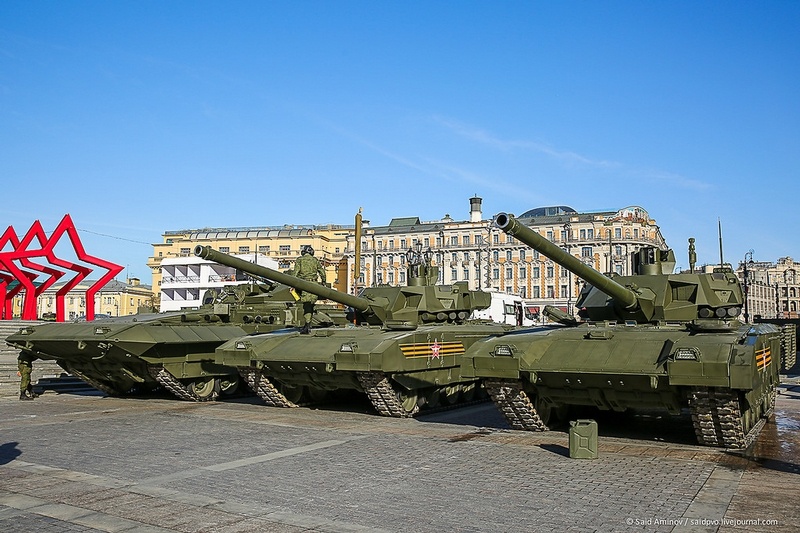
Armata Tank
Photos Courtesy: RT and EnglishRussia