Chinese stocks have soared this year with the Shanghai Composite Index up over 55% in dollar terms. As the share prices have increased the market capitalization of China exchanges are also rising sharply compared to major exchanges of the world.
The chart below shows the top global equity markets ranked by market capitalization:
Click to enlarge
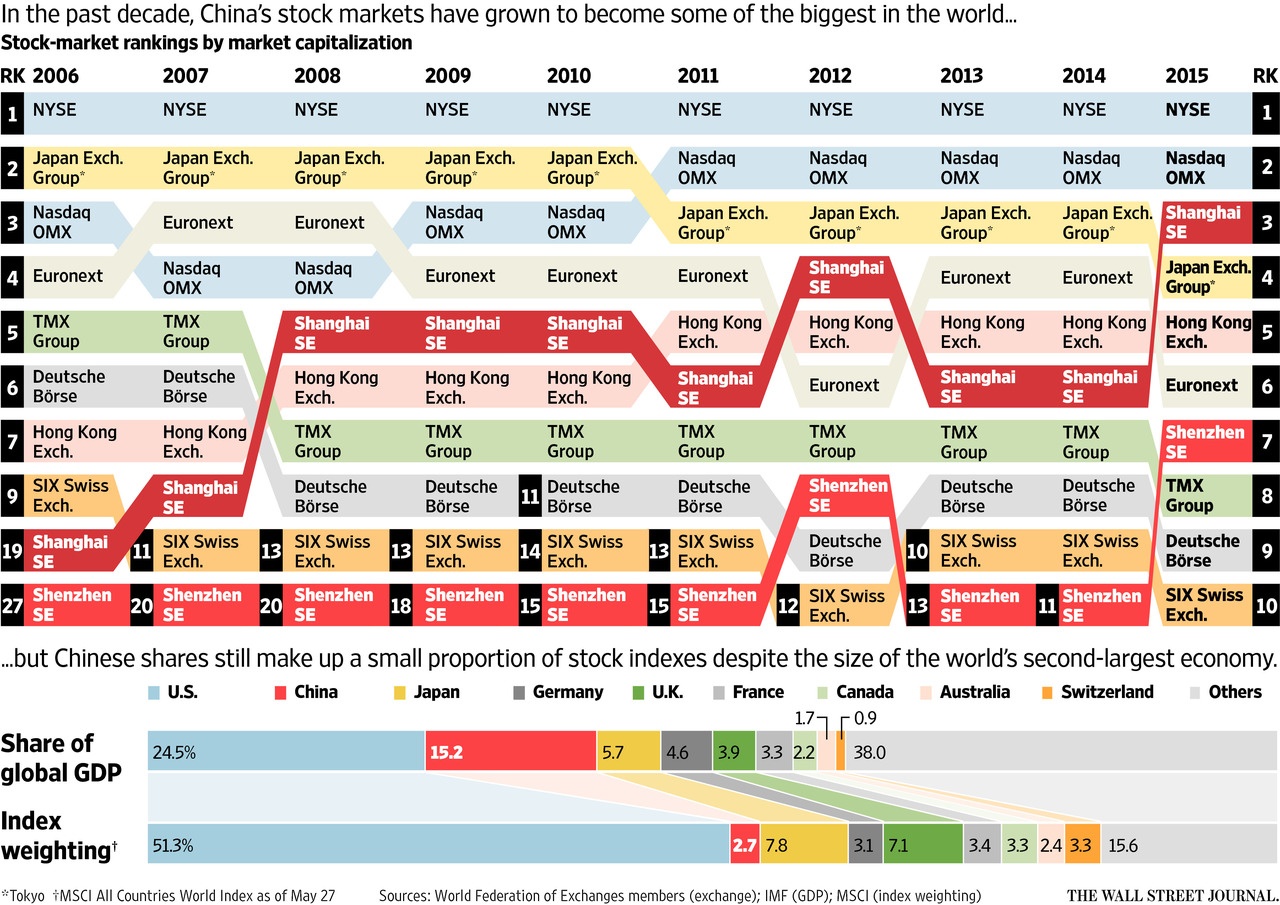
Source: Stakes Are High Over MSCI’s Decision on Chinese Stocks. WSJ, May 31, 2015
Though the U.S. economy accounts for just one-fourth of the global economy, MSCI gives high weighting to U.S. equities with an allocation of over 51% for U.S. stocks. Despite their large economies, the equity markets of Russia, Brazil and India are not large enough to appear in the top 10 rankings.For example, though more than 5,000 companies are listed on the Bombay Stock Exchange(BSE), the total market capitalization was just about $1.7 Trillion in January, 2015. The NYSE market cap is about 10 times that of the BSE.