The current yield on the U.S. 10 year Treasury note is 1.96%. In the past five years, the yield has dropped from about 4% to about 2% recently. In the past, U.S. Treasuries have yielded excellent cumulative returns during certain periods.
The following chart shows the historical yield on the U.S. 10-year Treasury from 1954 thru 2014:
Click to enlarge
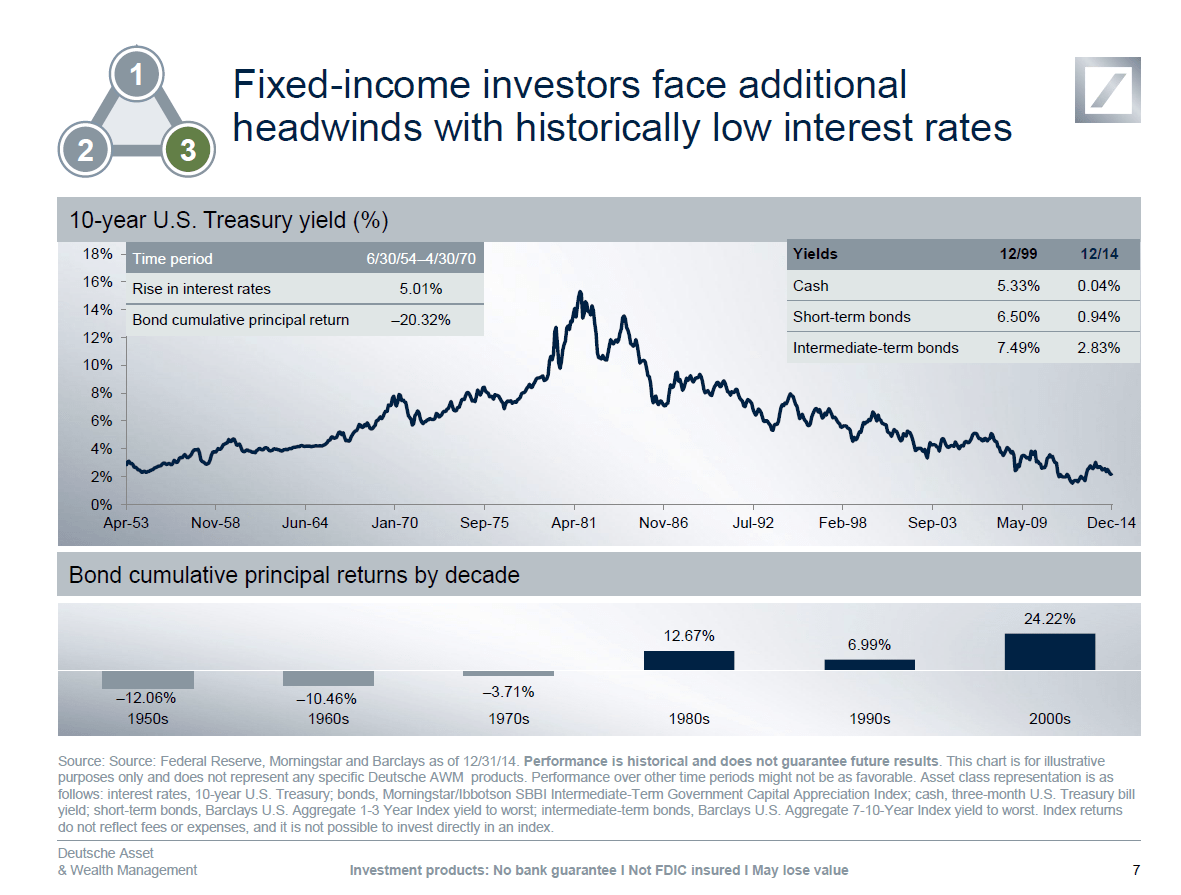
Source: Global Market Insights – Inefficiencies and opportunities in today’s fixed-income markets, Deutsche Asset & Wealth Management
The yield rate peaked in the 1980s when it reached over 14%. Since then it has followed a long-term downward trend.
With the yield treasuries so low its no wonder investors are putting more money into U.S. equities. There are plenty of equity opportunities which have dividend yields of well over 2%. Of course, equities are not the same U.S. Treasuries but still there is a reason investors are attracted to high-quality dividend stocks these days.


