In a recent article I wrote that most small businesses and start-ups in the U.S. do not survive very long. Even some large-cap companies like the Fortune 500 disappear in the long run due to mergers or bankruptcies.
Since the U.S. was founded only a couple of hundred years ago, there are no companies here that lasted for hundreds or even a thousand years. However this is not case in other countries. There are businesses exist that today that were originally started very long time ago – hundreds and hundreds of years ago. Here are ten such businesses from an article in Australia’s top news site:
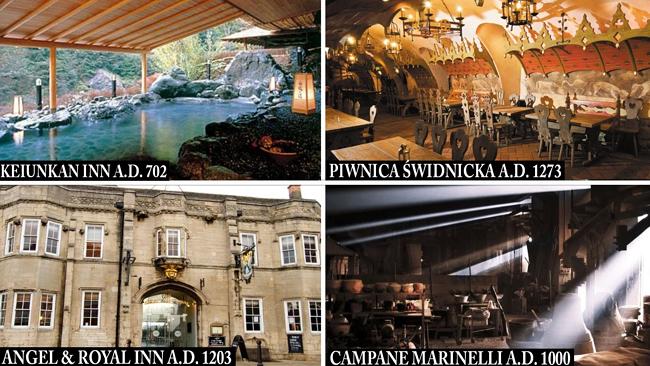
- The Keiunkan Inn, Japan – Founded in A.D. 705
- Stiftskeller St. Peter, Salzburg, Austria – Founded more than 1,200 years ago
- Staffelter Hof, Germany – Founded in A.D. 862
- Sean’s Bar,Ireland – Dates back to A.D. 900
- The Marinelli Bell Foundry, Agnone, Italy – Founded in around A.D. 1000
- Angel & Royal Inn, England – Founded in around 1203
- Frapin, France – Founded in 1270
- Piwnica Świdnicka, Poland – Opened in 1273
- Stora Enso, Sweden & Finland – Original firm started in 1288
- Pivovar Broumov, Czech Republic – Dates back to 1348
Source: Ten ancient businesses that still exist, July 14, 2015, News.com.au
Today Finland-based Stora Enso trades on the OTC market under the ticker SEOAY.
The entire article is fascinating to read.
Disclosure: No Positions