The The collapse of the City of Glasgow Bank (CGB) collapsed in October 1878. Before the recent financial crisis, it was the largest commercial banking failure in the United Kingdom.
When the bank collapsed shareholders were wiped out. In those days, the public helped out these investors by collecting donations. This is unthinkable today….
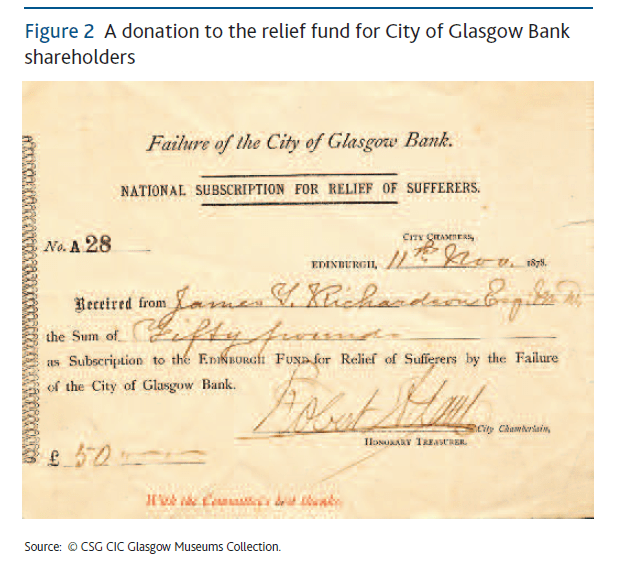
Here is a receipt for a donation made by someone:
Click to enlarge
From a research report on CGB’s failure by the Bank of England:
The suffering and financial burden placed on shareholders was widely covered in the press. Coverage typically portrayed the shareholders as socially vulnerable and financially ruined investors, with small shareholdings.The public were reported as viewing the failure of CGB and the impact on its shareholders as a national tragedy. Public sympathy led to fund-raising events for CGB shareholders, including the establishment of a relief fund, which received £379,670 in donations by 1882, and even a public recital of the works of Shakespeare.
Source: Desperate adventurers and men of straw: the failure of City of Glasgow Bank and its enduring impact on the UK banking system, Bank of England