Merry Christmas to all !
- Oh Canada…Canada’s year of ‘serial disappointments’ leave investors reeling (Financial Post)
- It’s Jammin’: Jamaica’s Tiny Stock Market Conquers World in 2015 (Bloomberg)
- Why dividend cover is important – and which FTSE 100 stocks fall short, Money Observer and Dividend danger: how will the FTSE 100 fare in 2016?, CityWire, UK and Just one of top 10 Footsie dividends looks safe: How to tell when an income stock will actually deliver, This is Money
- A fresh take on UK equities, JPMC
- What We Can Learn From Reagan About Celebrating Christmas , The Heritage Foundation
- Why China’s slowdown won’t wreck the Western recovery, FE Trustnet
- Global Stock Market Valuations and Expected Future Returns, Guru Focus
- Automotive industry dominates German foreign direct investment (DB Research)
Some past articles from this site to review as you prepare for 2016:
- Duration of Stock Holding Periods Continue to Fall Globally
- 10 Reasons to Invest in Foreign Stocks
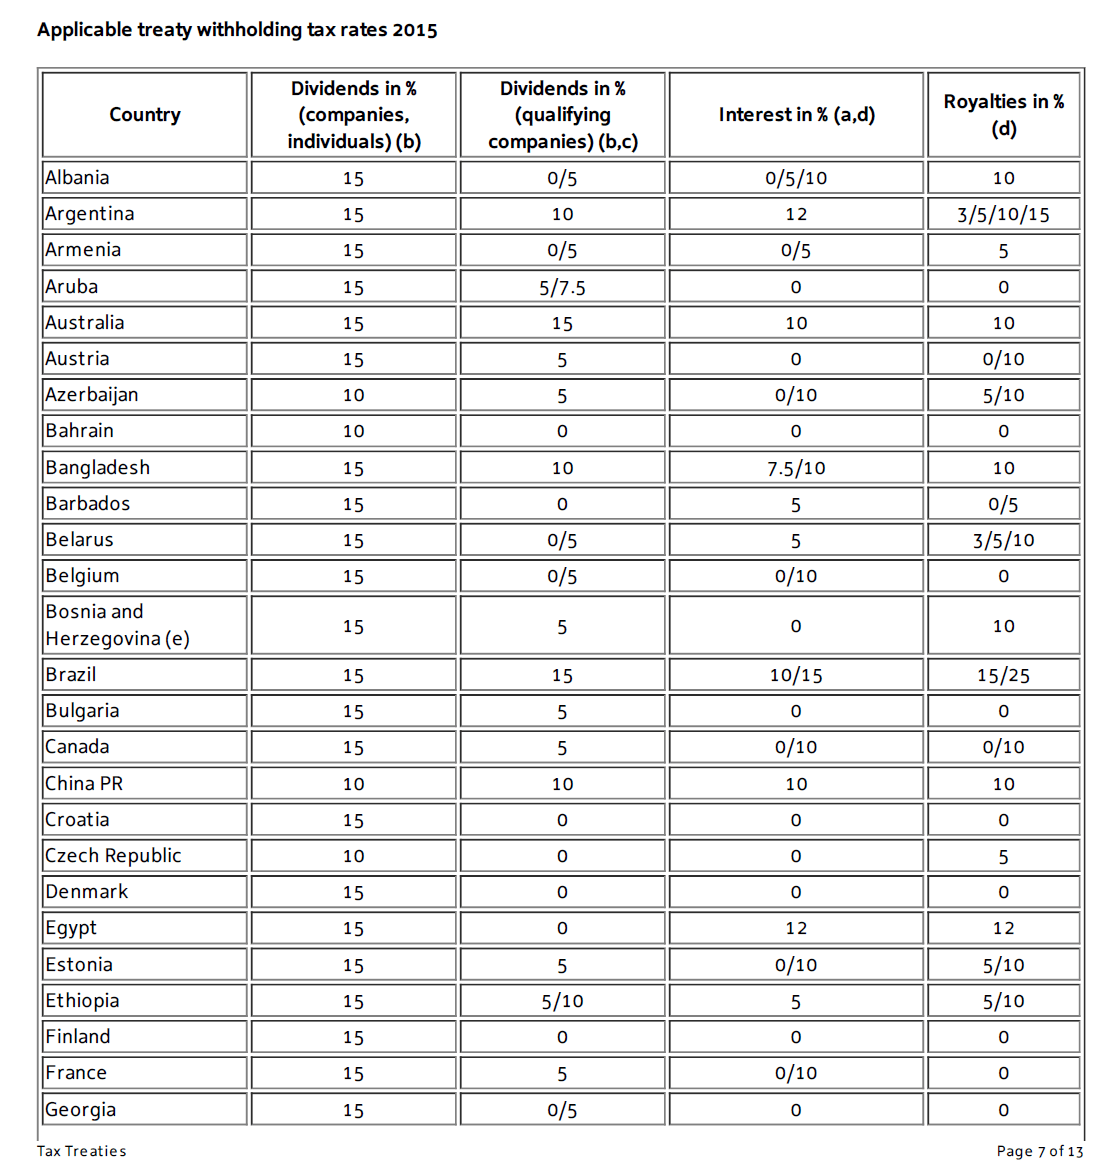
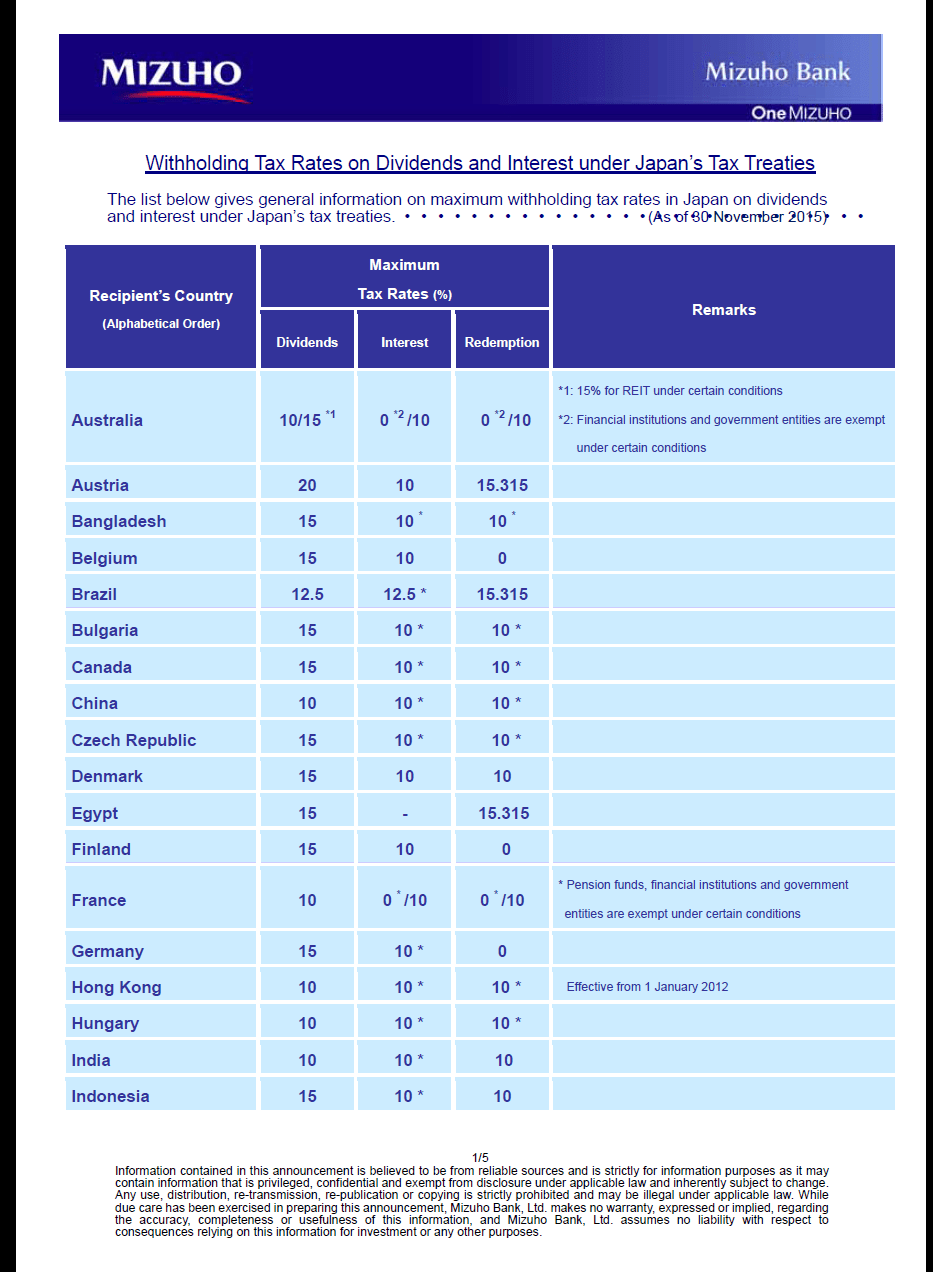
- Dividend Withholding Tax Rates By Country 2015
- The Complete List of Biotech Stocks Trading on NASDAQ
- The World’s Top 100 Non-Financial TNCs Ranked by Foreign Assets
- The Full List of Indian ADRs
- The Full List of Chinese ADRs
- The Full List of Russian ADRs
- The Full List of Brazilian ADRs

Tanybwlch Train Station, North Wales, UK