Over the past few years investors hungry for yield have piled onto dividend paying US stocks. While companies have increased dividends in recent years the party may not continue. According to an article by Credit Suisse, the scope for further dividend increases by US companies is getting narrow.
From the article:
Flush with cash and lacking exciting growth opportunities, many American companies have been about as “shareholder friendly” as they come over the past five years. Since 2010, dividends per share at S&P 500 companies have grown twice as fast as revenues. Alas, Credit Suisse believes the scope for further increases is narrowing. Dividend payments as a percentage of earnings are high compared to historical levels, particularly for the companies that pay the highest yields.
Click to enlarge
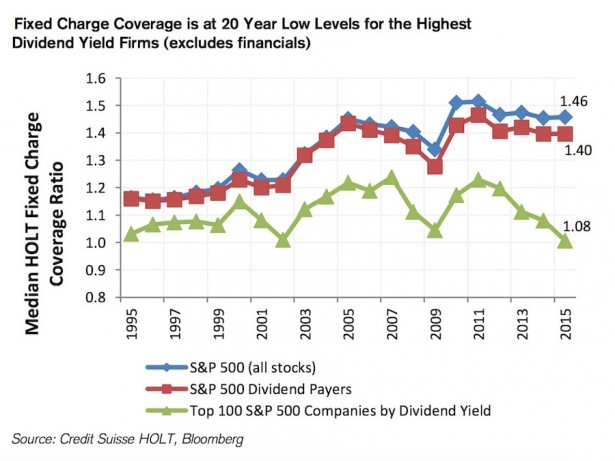
What’s more, the HOLT Fixed Charge Coverage ratio, a proprietary Credit Suisse measure that compares cash flow to fixed charges such as dividends, interest payments, and rent, is at a 20-year low. That suggests that even though companies have high cash balances – S&P 500 companies held $1.43 trillion on their books in the second quarter, the second-highest amount ever – they may not have the financial flexibility to increase their dividends in the future. Besides, much of that cash is concentrated in two sectors, tech and information technology, and a number of companies have cash parked overseas that they cannot use to increase dividends without paying a hefty repatriation tax.
Source: One Chart: Is the Golden Age of Dividends Over?, The Financialist by Credit Suisse, December 21, 2015
In general, here are some key points to consider when picking dividend stocks:
- Stocks with High dividend yields do not necessarily mean better. Its important to check how they are able to pay such dividends and if it is sustainable in the future.
- Sometimes firms borrow money by issuing debt to pay dividends when earnings sink. Investors can avoid companies repeatedly using this strategy.
- Increasing dividends with rising earnings is good.
- Dividends are not guaranteed no matter what the yield is or what a company earns. They can always be suspended or cancelled at any time. However large-cap established firms are unlikely to do so.
- It is always better to select consistent dividend payers that have maintained or increased dividend payments over many years.