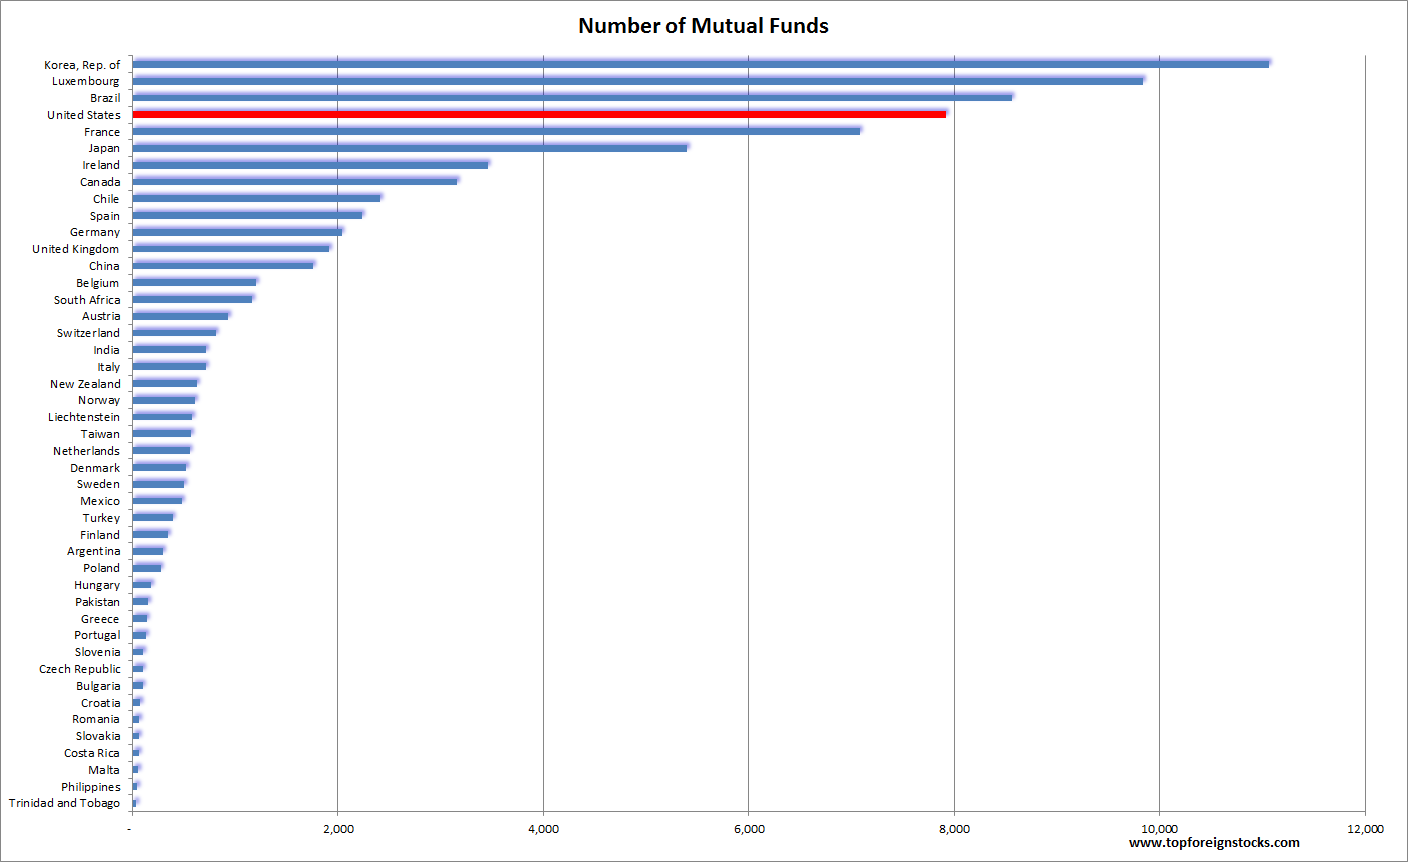
Number of Mutual Funds by Country

The mutual funds industry is a big business globally. In the developed countries it is especially large due to the amount of investment capital available. Billions of dollars are run by fund managers on behalf of their investors. Since billions of dollars of fees are at stake, fund companies offer a variety of funds based on many categories such as growth, sector, country, region, dividend, etc. In addition, even within the same fund different classes are offered to differentiate between fee types, amount invested, type of investor, etc.

How many mutual funds exist in countries around the world?

According to the Investment Company Institute, the fund industry’s trade body, there were over 79,000 mutual funds in the world at the end of 2014. The chart below shows this number broken down by country:

Click to enlarge

Number of Mutual Funds by COuntry

Notes:

  1. Funds of funds are not included except for France, Italy, and Luxembourg. Data include home-domiciled funds, except for Hong Kong, the Republic of Korea, and New Zealand, which include home- and foreign-domiciled funds.
  2. Data Source: International Investment Funds Association

Source: Investment Company Institute

A few observations:

  • Region-wise Europe has the largest number of followed by the Americas.
  • Korea has the largest number of funds in the world with over 11,000 funds listed.
  • The US has over 7,900 funds. This number is more than the total number of public-firms listed on the US markets.
  • Among the BRICs, Brazil has more than 10 times the number of funds in India.

Download:

Data for the above chart and more (in Excel format)

On the Growth of Mutual Funds in the US

The mutual funds industry in the US is a multi-trillion dollar industry.At the end of 2014, the industry managed assets of about $16.0 Trillion up from just over $1.0 Trillion in 1990. The growth in assets under management over the years has also led to a fierce competition with a multitude of players entering the market. According to the latest full year data available from Investment Company Institute the total number of mutual funds stood at 7,923 at year-end 2014.

The following chart shows the growth in the number of mutual funds by year:

Click to enlarge

Number of Mutual Funds by Year

Note: Data for funds that invest primarily in other mutual funds were excluded from the series.

Source: Investment Company Institute

The growth of the mutual funds business since 1980s is astounding. As the above chart shows, year after year the number of funds consistently increased only dipping slightly after the dot-com crash of 2000 and the global financial crisis of 2008-09. Since the most recent crisis, the number of funds is on an uptrend again.

The number of funds available on the market for investors has increased due to many factors such as the introduction of 401-k type retirement plans, growth in technology, change in investors’ risk appetite, highly successful marketing tactics by the industry, etc. For instance, with a 401-k retirement plan, up until recently most employers offer only mutual funds to participants. Hence employees had no choice but to select one of the handful of funds presented to them. This indirectly “forced” workers in a fund whether they liked it or not. As the number of participants grew each year billions of dollars were channeled to fund companies each month with automatic deductions from employee’s payroll.

As investors poured money into the thousands of mutual funds on the market, the industry created many classes of funds to cater to various types of investors. These classes of funds differ based on many factors like front-end fees charged, back-end fees charged, contingent-deferred sales charge, with sales charges, without sales charges, amount of capital invested by investors, retail investor, institutional investor, etc.

Slicing and dicing the number of limited stocks listed on the markets, the industry had created over 24,200 fund classes for over 7,900 funds. So on an average each fund has three types of fund classes. This 24,200 figure is many times more than the actual number of listed companies on the US market. To put this number into perspective, the total number of US companies traded on the US exchanges at the of end 2014 was just 5,283. So the industry has flooded the market with funds equal to nearly five times the number of companies listed.

Whether the huge number of available funds and the fund class types is beneficial to an investor or the fund companies is open for debate and is beyond the scope of this post.

Download Data: 

Average Tax Rate on Cigarettes by Country

Cigarettes are one of the most highly taxed products around the world. Equity investments in cigarette companies generally tend to payoff well in the long run as firms in the sector provide solid dividends and stable consistent growth. Successful investors have long observed the unique advantages of making money from cigarette makers. Here is a quote from Warren Buffet:

I’ll tell you why I like the cigarette business. It cost a penny to make. Sell it for a dollar. It’s addictive. And there’s a fantastic brand loyalty.”

In addition to investors, states also benefit tremendously from users of this product due to taxes. In order to discourage smoking, taxes on the stuff is usually high in most countries. In the U.S. states like New York have one of the highest tax rates on cigarettes. High taxation brings in millions of dollars in revenue for the states. Globally taxes on cigarettes varies by country with the UK topping the list and the UAE charging the least with the average tax at just 20%.

The table below shows the average tax rate on cigarette by country:

Click to enlarge

Cigaraette Taxation Rate by Country

Source: To protest anti-smoking measures, Indian cigarette companies are… shutting their factories?, FT Alphaville

Among the developed countries, the US has the lowest average tax rate at 42.5%.

Related posts:

Why Search for High-Yielding Dividend Stocks Abroad

When searching for income stocks foreign markets offer many attractive opportunities. Stocks with dividend yields of 3% or more can be found abroad to the 2% for US stocks as represented by the S&P 500. Though many sectors within the S&P 500 such as telecoms have much higher dividend yields, investors looking to diversify and also earn potentially higher returns can find excellent companies in foreign markets.

The following graph shows the 2016 Dividend Yield Estimates by Region for MSCI Indices:

Click to enlarge

MSCI 2016 Dividend Yield by Region Estimates

The table below shows the 2016 Dividend Yield Estimates by Region for MSCI Indices by Sector:

MSCI 2016 Dividend Yield by Sector Estimates

Source: Dividends Rediscovered, Thornburg Investment Management

High income stocks are found in the energy, utility and telecom industries in the U.S. Since the major companies in these sectors tend to be stable and slow growers they are usually the preferred areas of the market for income seeking investors. Within these sectors, Australian firms have higher yields than the US firms.

IT and consumer discretionary sectors are better suited for growth potential than dividends. Hence the dividend yields of this sector is very low in the US.

Other than healthcare, Australian companies have yields ranging from over 3% to 6%. For US investors Australia is a great place to look for dividend stocks.

Investors generally tend to overlook the Nordic region. However Nordic countries offer many pros such as being outside of the Euro zone. For example, in the Nordic telecom industry, Telenor ASA (TELNY) offers a 6% dividend yield.

Financials in other developed have substantially higher yields than in the U.S.

Disclosure: No Positions

Knowledge is Power: Emerging-Market Supercycle, Canadian Banks, Building Blocks of Diversification Edition

  1. “I got nothing against the press” (Vanguard Blog for Advisors)
  2. Will Rising U.S. Debt Levels Keep the Fed On Hold? (Schwab)
  3. Is South Africa the next Brazil? (Money Observer)
  4. What Will Drive the Next Emerging-Market Supercycle? (AB Blog)
  5. The House View: The Building Blocks of Diversification (Salient)
  6. Natural Capital: What Is the True Cost of Food? (Der Spiegel)
  7. The growth-and-value cycle (Fidelity)
  8. The data that proves just how much active emerging market funds have let long-term investors down (FE Trustnet) and see Do active funds do better in bear markets? Nope (MoneyWeek)
  9. CIBC is no longer the underdog of Canadian banking as performance and dividend beat rivals (Financial Post)

Rockefeller Center-2015

Rockefeller Center, New York