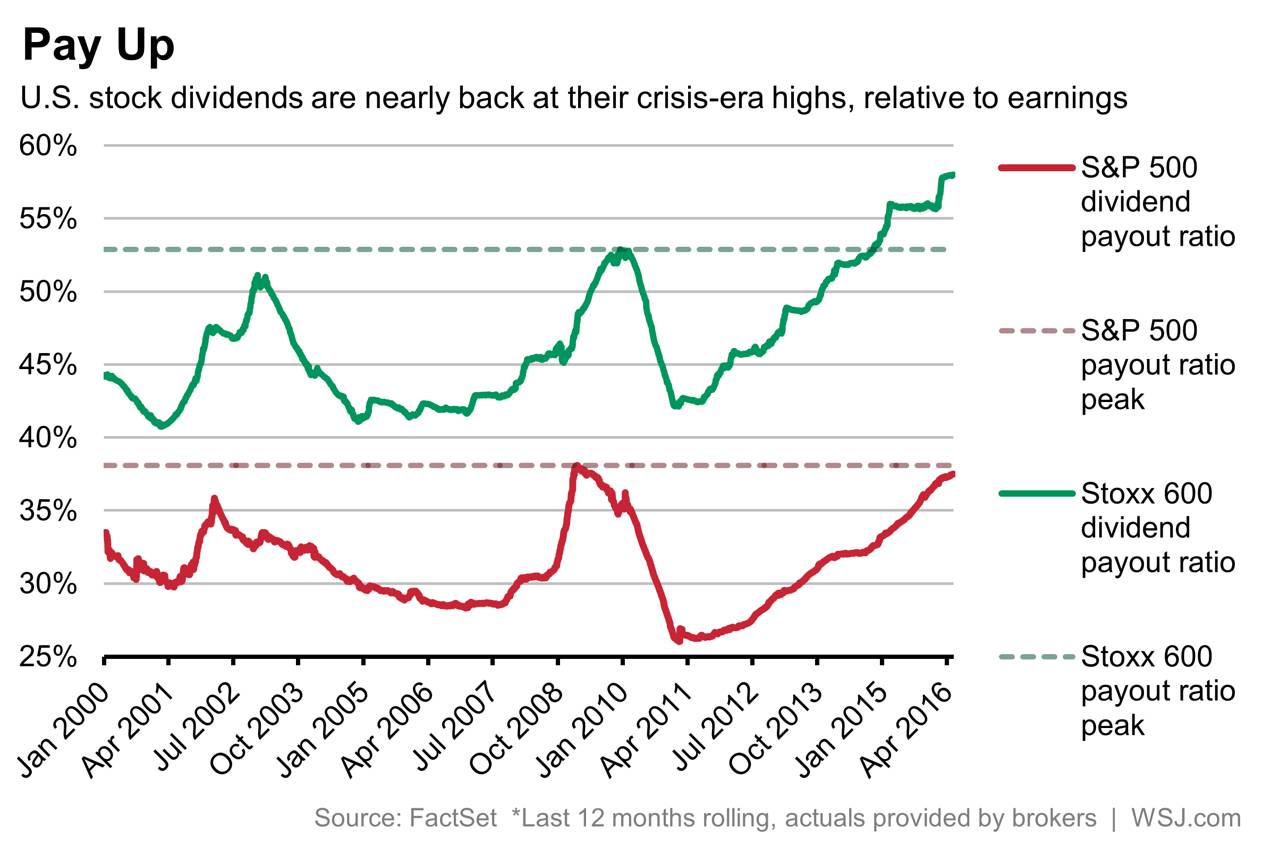
On The Current State Of German Households

The media and the certain sections of public generally focus on macro economic indicators such as GDP in order to discuss the well-being of a country. But how do all the over-hyped figures such as the GDP, GDP Growth Rate, etc. impact the average person on Main Street is important. For instance, the US economy is the largest in the world at over $16.0 Trillion and the GDP per capita is over $53,000. These figures do not mean much when the number of people surviving on food stamps is growing, wages are stagnant, people are unhappy, debt levels are soaring again, crime rates are increasing, etc. In this post, lets take a look at three charts on the current state of households in Germany. Looking at data at the household level shows the real impact of economic growth or lack there of based on a report by the OECD.

1. German Real GDP and Real Household Disposable Income per Capita:

Click to enlarge

German Real GDP and Real Houseehold Disposable Income per Capita
The above chart shows the development of real GDP per capita and real household disposable income per capita since the first quarter of 2007.Both the figures have steadily increased over the years which is good for the economy as a whole.

2. German Household Savings Rate:

German Household Savings Rate

Germans are big savers and not spenders. Unlike the US economy which is a consumption-based  Germany’s economy is export-driven. The household savings rate in Germany was 16.9% in 3Q, 2015 and the average rate is 16.7. The rate is not only high among OECD nations but also highly stable. The latest US personal saving rate is just 5.2% according to St.Louis Fed.

3.German Households’ Indebtedness:

German Households Indebtedness

The chart shows a consistent decline in the indebtedness of German households. One does not need a Ph.D in Economics to understand that lower debt levels are a big positive factor for households.

4. German Unemployment Rate:

German Unemployement RRate

High unemployment rates lead to distressed households. The German unemployment rate stood at 4.6% in 3Q, 2015 the lowest level since 1991. In January, the rate has dipped further to 4.3% according to DeStatis.

Source: A dash of data: Spotlight on German households, OECD Insights

The Stock Market Cycle

The behavior of stock market tends to follow a cycle.Similar to many conditions of an economy such as expansion, contraction, stagflation, etc. stock markets also go thru periods of booms followed by bust.

The following is an interesting chart by Liz Ann Sonders at Charles Schwab. According to an article by Liz, the stock market tends to have four cycles.

Click to enlarge

Stock Market Cycle


From the article:

The stock market has familiar cycles dating back to at least the 1960s. The visual below (and the accompanying detailed set of tables below that) highlights these cycles and their direction. Each box in the graphic below shows the median return and duration for the seven of these cycles we’ve seen since 1968; but also the return and duration for the most recent phase of the current cycle. The cycles utilize the bull and bear market definitions pioneered by Ned Davis Research (NDR), which are more nuanced than the simple +20%/-20% traditional definition.

The full article is worth a read.

Source: Echo: Are Stocks Getting Back in Cycle? by Liz Ann Sonders, Charles Schwab

Germany in Numbers

Germany is the economic powerhouse of Europe and so easily beats Eurozone in GDP growth. But Germany lags behind the US as the chart shows below. Germany consistently runs a trade surplus since it exports more than imports.

Click to enlarge

Germany in Numbers

Source: Investing in Germany, FT Special Reports

Related ETF:

  • iShares MSCI Germany ETF (EWG)

US investors can invest directly in about 100 German firms via ADRs. The full list of German ADRs trading on the US markets can be found here.

Disclosure: No positions

OECD: Net Government Debt Offers A Better Picture Of Government Financial Health

Gross Government Debt as a percentage of GDP gets attention when we evaluate government finances. However according an article by Patrick Love at the OECD, Net Government Debt is also an important factor to analyze in addition to Gross Government Debt. This is a valid argument since assets held by a government is also important as those assets can be sold off to pay off liabilities or can be a significant source of generating income. From the article:

In analysing the sustainability of government finances, the focus tends to be on gross government debt as a percentage of GDP. However, as gross debt does not take into account the asset side of government balance sheets, this measure only tells part of the story. Assets may generate income or be sold in order to redeem part of gross debt, and are therefore very relevant in assessing the financial health of government as well. A government with a high level of liabilities but also with significant amounts of assets on its balance sheet may be better off than a government with a lower level of liabilities and hardly any assets. Therefore, net government debt, which incorporates information on assets, constitutes a useful additional measure to gross government debt. It provides insight into the capabilities of governments to service debt in the longer run and thus presents a more comprehensive and nuanced picture of government financial health.

The chart below shows gross and net financial debt as a percentage of GDP in 2013 for select OECD countries:

Click to enlarge

Gross-and-Net-government-Debt-OECD-Countries

Source: Statistical Insights: Government assets matter too, not just debt by by Patrick Love, OECD Insights

Norway, Japan, Finland, Luxembourg, Sweden, Slovenia and Greece have large amount of financial assets. So they rank lower on the basis of net vs. gross government debt. United States, Hungary, Italy, Poland, Belgium and the Slovak Republic have low financial assets on their balance sheet. Hence the difference between their net and gross government debts is not substantial.

The chart also shows the Scandinavian countries are better than other European countries based on net government debt.

The Top 10 S&P 500 Companies By Sales, Net Income and Market Capitalization

Apple Inc. (AAPL) seem to be losing its shine. The stock has been in a flat to downward trend for many months now. In 5 years, Apple stock has more than doubled. However in one year, it is down about 15% excluding dividends and year-to-date it is basically flat.

Despite the lackluster performance, Apple still commands a market capitalization of over $585 billion, making it the most valued company in the S&P 500. Apple is also the most valued firm in the world. Apart from Apple, what are the top 10 firms in the S&P 500?

The following charts shows the top 10 firms in the S&P 500. Please note the data shown in the charts are from early Feb, 2016.

1.The Top 10 S&P500 Firms by Net Income:

Click to enlarge

Top 10 SP500 Firms by Net Income

2.The Top 10 S&P 500 Firms by Sales:

Top 10 SP500 Firms by Net Sales

3.The Top 10 S&P 500 Firms by Market Cap:

Top 10 SP500 Firms by Market Value

Oil giant Exxon Mobil Corporation (XOM) used to be on top of the largest market capitalization company rankings. But due to the collapse in oil prices and investors’ fascination with technology firms such as Apple, Alphabet, etc. today Exxon Mobil has a market cap of just $348 billion.

Source: Alphabet vs. Apple: Which is Bigger? by John Butters, Factset

Disclosure: No Positions