Dividend Growers Beat Dividend Payers And Non-Dividend Payers Over The Long Term

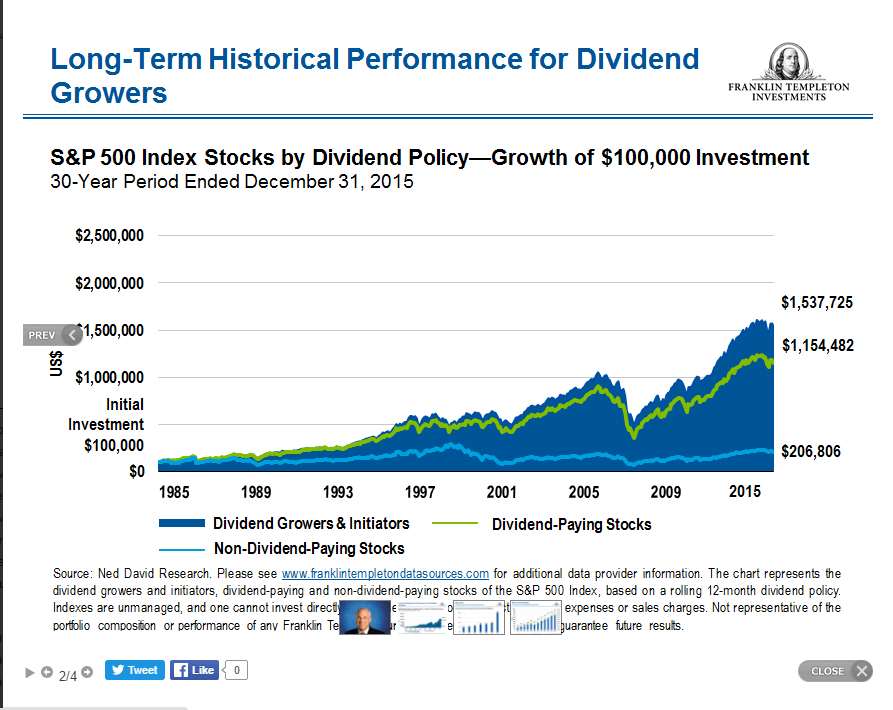
When picking stocks to hold for the long-term it is important to not only buy dividend payers but also own dividend growers. Companies that consistently raise their dividends year after year or even every few years tend to outperform those firms in terms of stock price growth that do not pay dividends or maintain the same dividends. The capital growth is especially huge when returns are calculated over many years due to the effect of compounding of dividend reinvestment.

The chart below illustrates the phenomenal growth of dividend growers over the long-term:

Click to enlarge

Dividend Growers beat Dividend Payers

Source: Dividend “Achievers”: Most Likely to Yield?, Franklin Templeton Investments, May 24, 2016

The S&P 500® Dividend Aristocrats® Index comprises of companies that have increased dividends consistently every year at least for the past 25 years. The following are ten constituents from the index that investors can explore for potential investment opportunities:

  1. Emerson Electric Co. (EMR)
  2. Lowe’s Companies, Inc. (LOW)
  3. AT&T, Inc. (T)
  4. Colgate-Palmolive Co. (CL)
  5. Leggett & Platt, Incorporated (LEG)
  6. Stanley Black & Decker, Inc. (SWK)
  7. Kimberly-Clark Corporation (KMB)
  8. Johnson & Johnson (JNJ)
  9. PPG Industries, Inc. (PPG)
  10. Abbott Laboratories (ABT)

Disclosure: No Positions

Though US Bank Stocks Are Under-Performing Now, Future Looks Bright

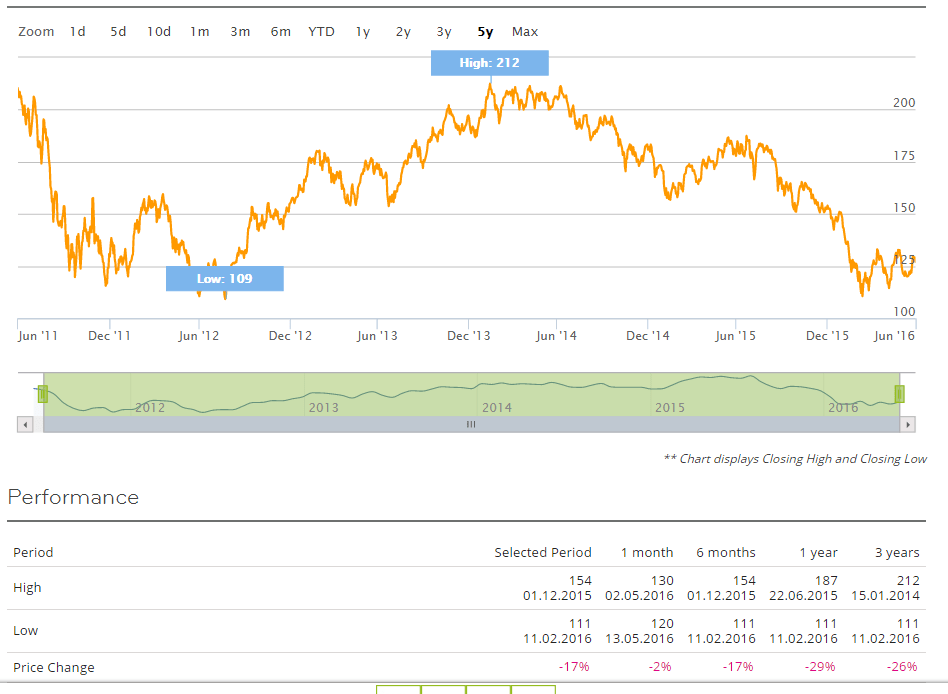
The S&P 500 is down 1.67%. The benchmark index for major US banks, KBW Nasdaq Bank Index,  has declined more with a loss of 2.79% so far this year.

The chart below shows the 5-year return of the index:

Click to enlarge

KBW Bank Index-5 Years

Source: Yahoo Finance

Though banks are lagging the S&P 500, over the past 5 years the index has jumped nearly 50%. This is not surprising since banks were the most adversely impacted during thee financial crisis and have recovered strongly since then.

Moving forward, US banks have a better future even if the Fed raises the interest rate. Compared to a few years ago, banks are in much better shape and are reaping the rewards of asset growth and expense reductions. Currently banks are enjoying the boom in all types of lending such as auto loans, student loans, mortgages, home equity loans, credit card loans, etc. Rising interest rates should generate higher revenues and earnings. For instance, total outstanding credit card debt is reaching closer to $1.0 Trillion. When rates go higher banks will generate higher interest revenue from this debt mountain.

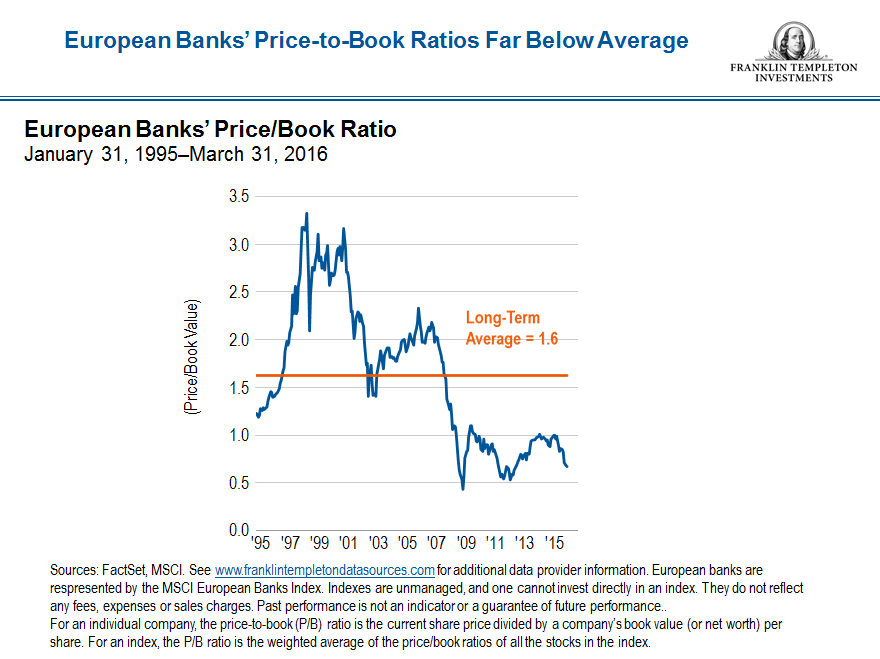
Hence from an investment point of view, investors can consider adding quality US banks in a phased manner. Relative to European banks US banks look attractive in terms of growth potential.

Note: You cannot invest directly in an index such as the KBW Bank Index.

Related ETFs:

  • SPDR S&P Regional Banking ETF (KRE)
  • SPDR S&P Bank ETF (KBE)
  • Financial Select Sector SPDR Fund (XLF)
  • Vanguard Financials ETF (VFH)

Disclosure: No Positions

CAC-40: Total Returns by Year

The CAC-40 Index, the benchmark index for the French equity market is down 4.4% year-to-date. In the past 10 years, the index is still in the negative with a loss of around 11%.

Overall on a average French stocks have yielded a positive return over many years. Since dividends account for a high portion of total returns in the French equity market it is important to review the total return and not the price return.

The following chart shows CAC-40 total returns by year since its inception in 1988 thru 2015:

Click to enlarge

CAC-40 Total Returns by Year

Source:Why share they rise in the long term? (Google’s French translation), Yomoni

According to the article, French stocks as measured by the CAC-40 have gained an average of 8.5% since 1986, an average of 5-6% more than government bonds. Clearly 8.5% return per year is solid. However the returns are not evenly distributed as shown above. Hence the key to success in equity investing is to hold stocks for the long-term and let factors such as dividend reinvesting multiply the returns over many years.

Related ETF:

  • iShares MSCI France ETF (EWQ)

Disclosure: No Positions

Chart: US Manufacturing as a Percentage of GDP and Income Inequality

The Manufacturing industry has been declining for many years now. While in the past an average American with a high school diploma could get a well-paid job in a local factory and settle down by raising a family, today’s average American with the same diploma might be lucky to find a job flipping burgers at minimum wage at a fast food restaurant. In today’s US a college degree is mandatory even to get a half-way decent job, if one can find one. The decline in manufacturing has forced millions of Americans into the service sector which tend to have poorly paid jobs with no benefits. 

The hollowing out of US manufacturing over the years by outsourcing those jobs has led to a decline in standard of living for average Americans. For example, whites and blacks alike lost out when factories to Mexico and other countries after NAFTA was implemented. What jobs were left within the country such as those in construction and farming, were also taken over by illegal Hispanics leaving average-educated Americans fight for other jobs. Dramatic social and cultural changes are already occurring among whites and non-Hispanics. Some of such changes include higher suicides rates, mental issues, graduated college college students staying with mom and dad, etc.

The following chart shows US manufacturing as a % of GDP since 1997:

Click to enlarge

Manufacturing to GDP in US

One of the consequences of lack of decent jobs and wage growth is the rising inequality among the population. As the entire system is set up to benefit the rich get richer and poor become poorer income inequality continues to rise year after after. Hence on the one hand the country is a super power with fabulous wealth and awesome military and on the other hand millions of people survive on food stamps and charities or basically survive working multiple minimum wage jobs. This shocking dichotomy makes the country look like a cross between Switzerland and Somalia to those who can look beyond the brainwashing by the media.

The following chart shows income inequality since 1913:

Income inequlity in US


Source: Not all that it seems?, Barclays

Three Reasons To Consider German Stocks

German stocks have performed worse so far this year relative to other developed markets. For instance, the FTSE 100 is down just 1.38% compared to the DAX’s decline of 7.70%. The actual loss is even more since the DAX returns includes dividends when other indices do not.

From a May 20th article in the WSJ on this topic:

Despite the German economy gathering pace, its stock market has had a dismal year.

The headline DAX index has fallen fast this year, and stripping out dividends the performance looks even worse.

Unlike other indexes, from Britain’s FTSE 100 to the French CAC 40, the DAX measures gains on a “total return” basis. So instead of just taking into account changes in the prices of its stocks, this index includes dividends paid out by its component companies and assumes they are reinvested in the same stock. Another index that works like this is the American S&P 500.

This means the DAX tends to look better when compared with its neighbors.

Not this year. Even with dividends, the DAX is still down 8.8% year-to-date.

Other eurozone indexes haven’t fared well either. The CAC 40 has dropped 6.7% this year, the Spanish IBEX 35 is down 8.3% and the Italian FTSE MIB is down roughly 17.2%.

Strip out dividends and the DAX looks even worse, having lost 11.2% of its value.

Source: The German DAX’s Bad Year Is Even Worse Than It Looks, WSJ, May 20, 2016

Though the DAX has performed poorly this year, investors may still want to consider adding German equities in a phased manner at current levels. Listed below are three reasons on why investors should buy German equities:

1.No country consistently ranks as the top performer year after after as shown in the chart below:

Click to enlarge

Single-Country-Returns-Developed-Mkts

2.German stocks are cheap based on forward P/E ratio:

German stocks Chearp

3.US stocks are expensive based on Shiller P/E ratio while German stocks are cheaper:

Shille PE Ratio by Country

Shiller P/E (also known as cyclically adjusted P/E” or CAPE,) is a more accurate measure of predicting long-term returns.

Note: The above chart shows data as of May 7, 2016

Source: The Case for More Overseas Stock Exposure—and Where, WSJ, May 8, 2016

The easiest way to gain exposure to German stocks is via the iShares MSCI Germany ETF (EWG). It holds 55 large and mid-sized firms and currently has an asset base of over $4.2 billion.

Investors interested in individual stocks can consider the following for further research:

1.Company: BASF SE (BASFY)
Current Dividend Yield: 4.45%
Sector:Chemicals

2.Company: Henkel AG & Co (HENKY)
Current Dividend Yield: 1.61%
Sector: Household Products

3.Company: Siemens AG (SIEGY)
Current Dividend Yield:3.56%
Sector:Industrial Conglomerates

4.Company: adidas AG (ADDYY)
Current Dividend Yield: 1.44%
Sector:Textiles, Apparel & Luxury Goods

5.Company: Fresenius Medical Care AG & Co (FMS)
Current Dividend Yield: 1.08%
Sector: Health Care Providers & Services

Note: Dividend yields noted above are as of May 20, 2016. Data is known to be accurate from sources used.Please use your own due diligence before making any investment decisions.

Disclosure: No Positions