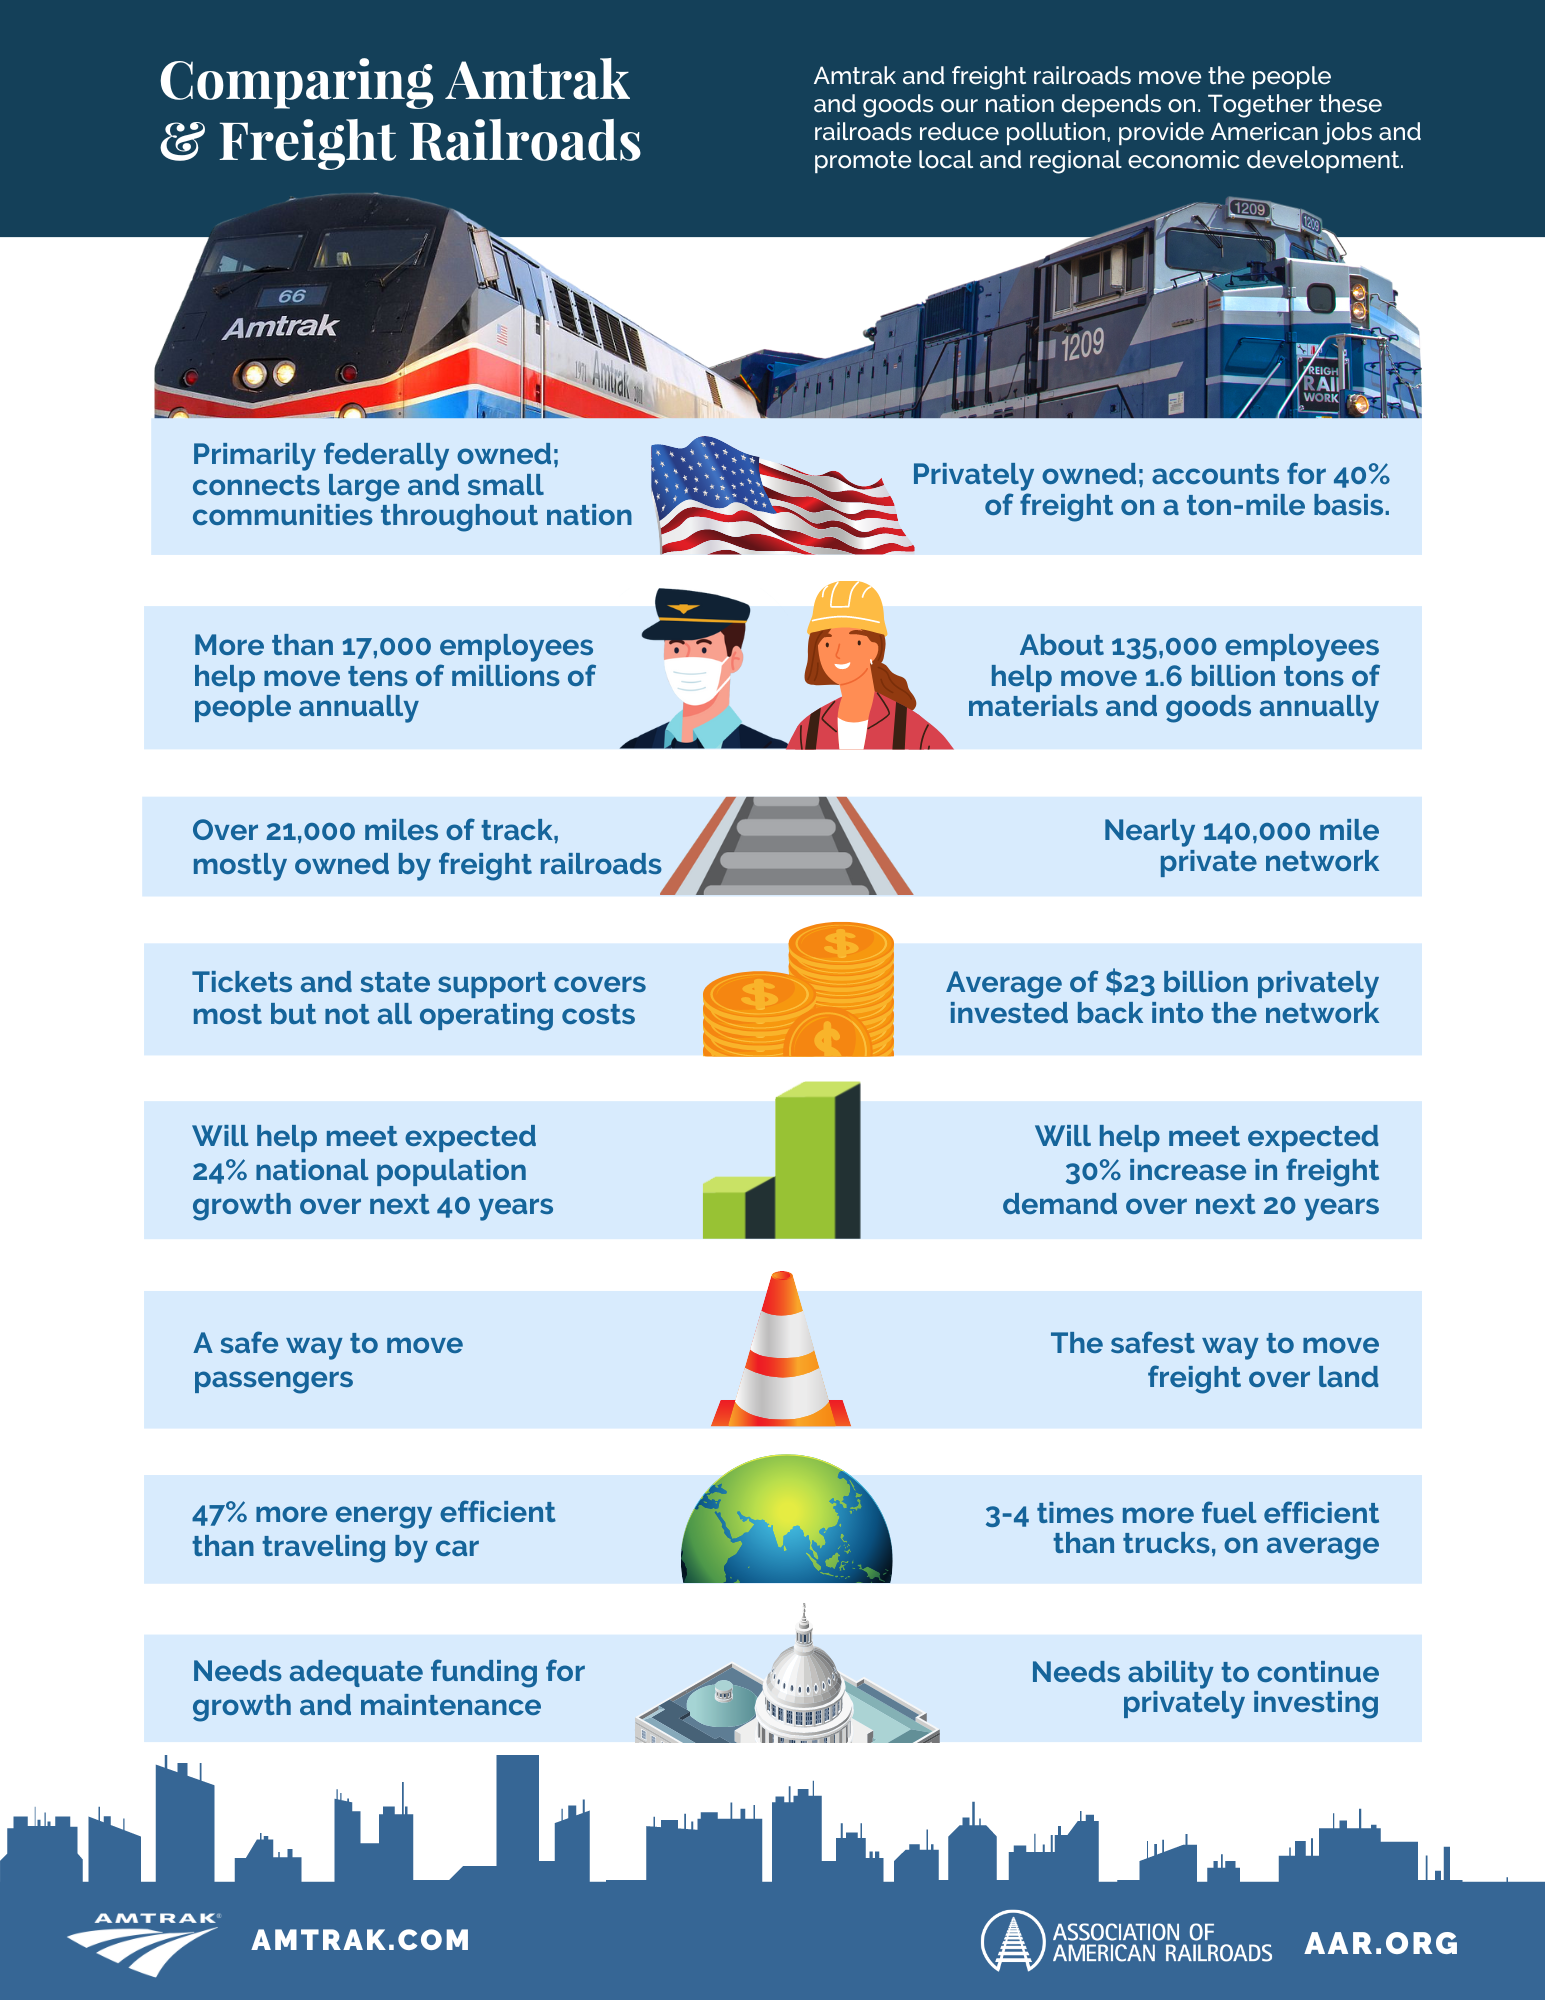
Comparing Amtrak & Freight Railroads: Infographic

Amtrak is the national passenger railroad company is the US. Unlike other countries Amtrak does not own most of the tracks its trains run on. Most of the tracks are owned by the freight railroad companies. So it is not uncommon Amtrak trains and freight trains compete for the same track at the same time. Since freight companies are the owners in many cases Amtrak trains would wait for clearance of the tracks. Below is brief excerpt from Wikipedia:

Amtrak’s network includes over 500 stations along 21,400 miles (34,000 km) of track. It directly owns approximately 623 miles (1,003 km) of this track and operates an additional 132 miles of track; the remaining mileage is over rail lines owned by other railroad companies. Some track sections allow trains to run as fast as 150 mph (240 km/h).

In fiscal year 2022, Amtrak served 22.9 million passengers and had $2.1 billion in revenue, with more than 17,100 employees as of fiscal year 2021. Nearly 87,000 passengers ride more than 300 Amtrak trains daily. Nearly two-thirds of passengers come from the 10 largest metropolitan areas; 83% of passengers travel on routes shorter than 400 miles (645 km).

Source: Wikipedia

Last year I posted an infographic on the differences between Amtrak and Freight Railroads. The following is another take on the topic:

Click to enlarge
Source: AAR

Related Stocks:

  1. CSX Corp (CSX)
  2. Union Pacific(UNP)
  3. Norfolk Southern Corp(NSC)

Disclosure: Long CSX, NSC and UNP

On The US Energy Consumption Mix

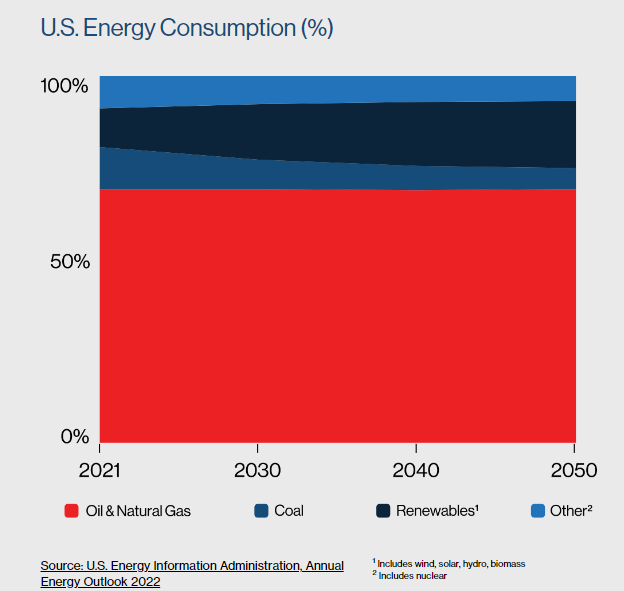
Oil and natural gas is the largest part of the US energy consumption mix. In 2021, it accounted for 70% according to EIA data. Though renewal energy is pickup in the past few years oil and gas will continue to play a major role in years to come. EIA projects the share of oil & gas in the energy mix would still be over 60% by 2050 though renewals gain share. Renewables alone are not possible to meet America’s energy needs. The 2021 Texas Energy Crisis is a classic example of this scenario.

Click to enlarge

Source: Canada is the solution

From an investment point of view, the US is a long way from abandoning fossil fuels. Unlike some smaller countries the country and the current political system and infrastructure is not made for major adoption of renewable energy sources. Hence investors in oil and gas producers and related companies need not worry about the country becoming a renewable energy leader anytime soon.

Related ETF:

  • United States Oil ETF (USO)

Disclosure: No positions

Work Hours vs. Wage of Select Few Countries: Chart

Labor wages vary across countries. For the same work, the wages in a developed country is traditionally much higher than in emerging countries. Hence it is no secret that companies looking to reduce labor costs tend to move their operations to the developing world. I recently came across an interesting article titled “Which country will be the next China?” by Jason Hsu of Rayliant Global Advisors in Australia. A small excerpt from the piece:

Between a rock and a hard place

China is great at what it does, and I don’t envy companies trying to diversify their supply chains. Consider Foxconn, the ‘gold standard’ for operating factories that manufacture high-end electronics. In response to increasing geopolitical pressure, the Taiwanese firm has made several efforts to expand beyond China.

In the United States, Foxconn reached agreements in both Wisconsin and Arizona to invest many billions of dollars in manufacturing plants. And recently, Foxconn signed a partnership with Vedanta Group to manufacture components in India. But as most of my readers know, these deals have all been scaled back or cancelled altogether, including some recent drama in which Foxconn said parts of the US lacked the skills and infrastructure to launch a plant.

I don’t want to speculate too wildly about specific cases like Foxconn’s. But it’s a simple business fact that the United States, United Kingdom, Germany, and other developed countries are simply too expensive and lack sufficient labor to replace Chinese manufacturing. In addition, cultural, employment, and labor norms have hampered Chinese manufacturing attempts in Western countries. (For those who haven’t seen it, American Factory is an excellent case study.)

At the other end of the spectrum, Africa offers inexpensive labor and investment opportunities. However, the infrastructure and labor force cannot currently support high-end and value-add manufacturing.

EM is the only viable option. But as Foxconn’s efforts in India demonstrate, there are challenges even within these markets.

Source: Which country will be the next China?, FirstLinks

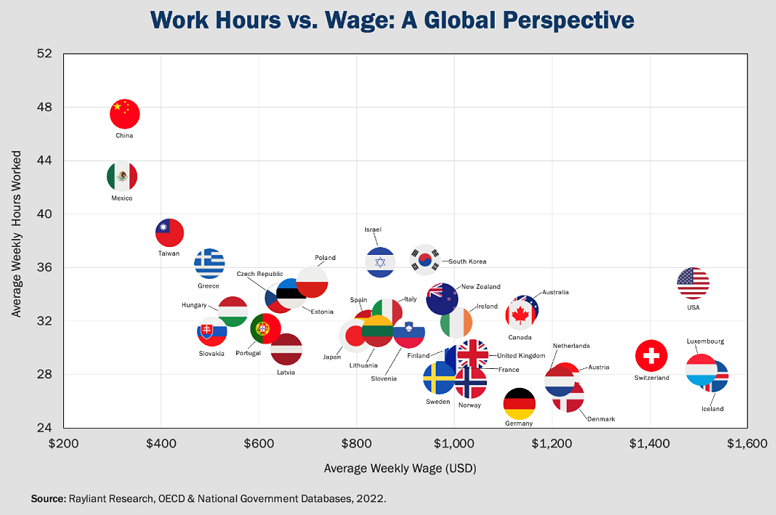
China has the highest hours worked per week and the lowest wages as shown in the char below. That is one major reason why China is the factory floor of the world. The second cheapest destination for labor wages is Mexico. Unions cutting deals directly with company managements and without worker representation have kept wages below.

The highest earners with lowest amount of hours worked are in Iceland, Luxembourg and Switzerland. Wages are higher in the US but the number of hours worked is also higher relative to most developed western European countries.

China’s Household Savings Rate and Household Expenditure as a share of GDP

The economy of China has been in the doldrum for the past few years since the pandemic. A recent article in the journal discussed the reasons China is unable to revive its stagnant economy and drive expansion. Unlike the US economy, the Chinese economy is manufacturing and export-based. Since the consumption is further down the economy is stuck in low growth mode. While western experts suggest the country increase its consumption of goods and services and become a consumption-based economy it is unlikely to happen.

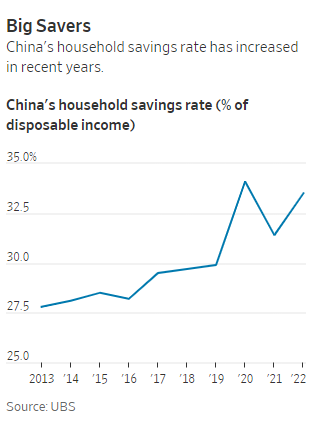
For starters, the Chinese are big savers and not spenders. The lack of major social safety nets like social security and others force people to save more for the future. This scenario will not change anytime soon. The following chart shows the household savings rate as a percentage of disposable income:

Click to enlarge

Source: Communist Party Priorities Complicate Plans to Revive China’s Economy

For comparison, the household savings rate in the US was 3.50% in July this year. No wonder consumption is a major part of the US economy.

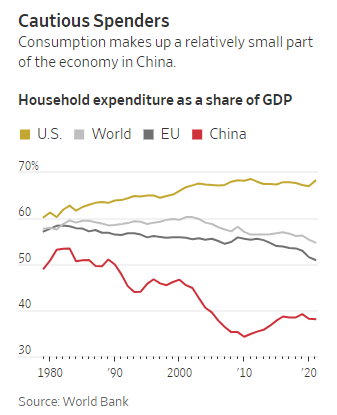
The chart below shows the Chinese household expenditure as a percent of the GDP relative to a select few countries:

Click to enlarge

Source: Communist Party Priorities Complicate Plans to Revive China’s Economy

The difference is indeed massive between the Chinese and US rates. The idea that China’s over 1.4 billion population can consume like there is no tomorrow on consumer goods and services is far from reality anytime soon.

On The Outperformance of US and International Stocks From 1971 to 2022

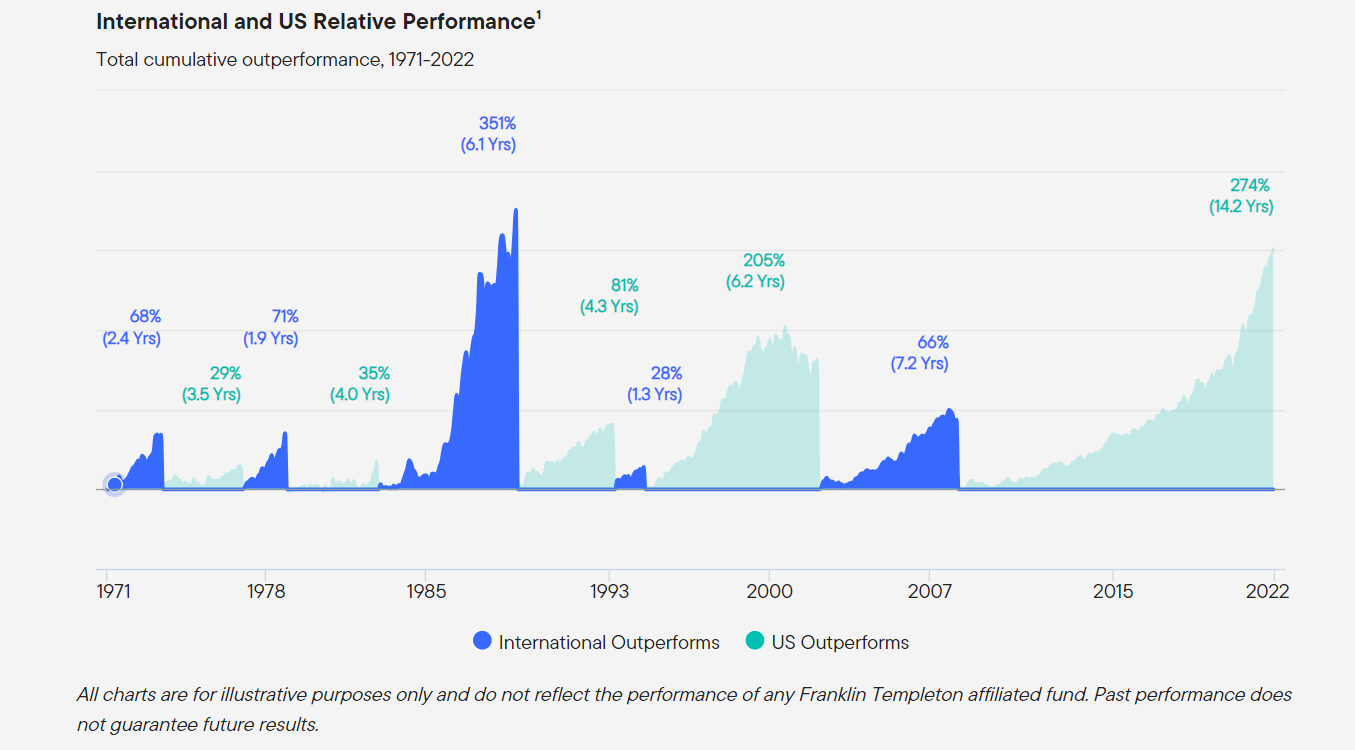
US stocks have performed very well in the past few years over their international peers. However that is not always the case. There have years when foreign stocks outperformed US stocks. The key point to remember is that the outperformance of US stocks over international stocks and vice versa rotate over the years. The following chart shows the relative outperformance from 1971 to 2022:

Click to enlarge

1.Source: Bloomberg, MSCI, 12/31/2022. International and US are represented by the MSCI EAFE and MSCI USA indexes, respectively. Peak to trough total cumulative performance calculated for periods of relative outperformance lasting 12 months or longer.

Source: Uncovering International Investment Opportunities, Franklin Templeton

One way to take advantage of this phenomenon is to diversify between these asset classes. Accordingly it is important to own both US and foreign stocks. Simply putting all the assets in just domestic equities is not a wise move. It remains to be seen if foreign stocks can outperform US stocks since 2022.

Relative ETFs:

  • SPDR S&P 500 ETF (SPY)
  • Vanguard Developed Markets Index Fund ETF(VEA)
  • Vanguard MSCI Emerging Markets ETF (VWO)

Disclosure: No positions