Life Expectancy At 65 For Select OECD Countries: Chart

The life expectancy at 65 is important because how long people people live after retirement. According to the latest OECD data, people in Japan live the longest at age 65 as shown in the chart below. Other countries with high life expectancy at 65 are Korea, Spain, France and Switzerland.

Click to enlarge
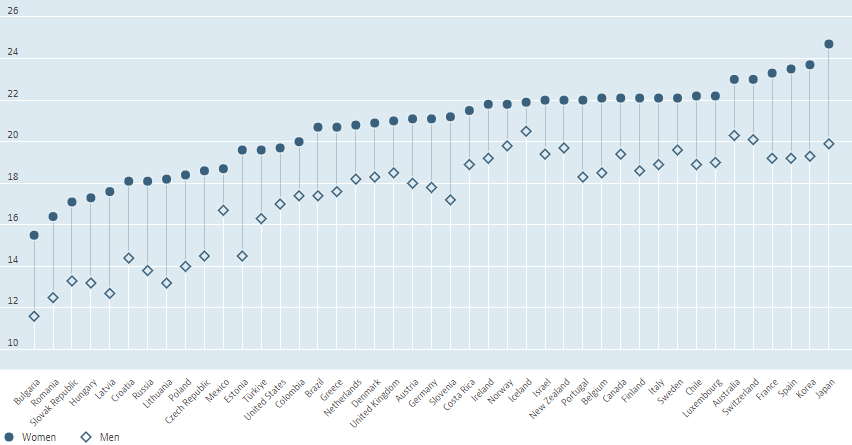
Note: The y-axis shows the life expectancy at 65.

Source: OECD via 30-year chart is pointer to retirement outcomes, Graham Hand, First Links

For Australia, the life expectancy at 65 for men is 20.3 years and for Women it is 23.0 years.
The Top 10 North America-based Auto Parts Suppliers 2023

Auto parts suppliers is one of the largest industries that supports the auto makers. From proving jobs to hundreds of thousands of workers to producing cutting edge parts these parts suppliers are a major backbone of the global auto industry. With the growth in EVs the parts companies are expanding their portfolios to take advantage of the EV industry.

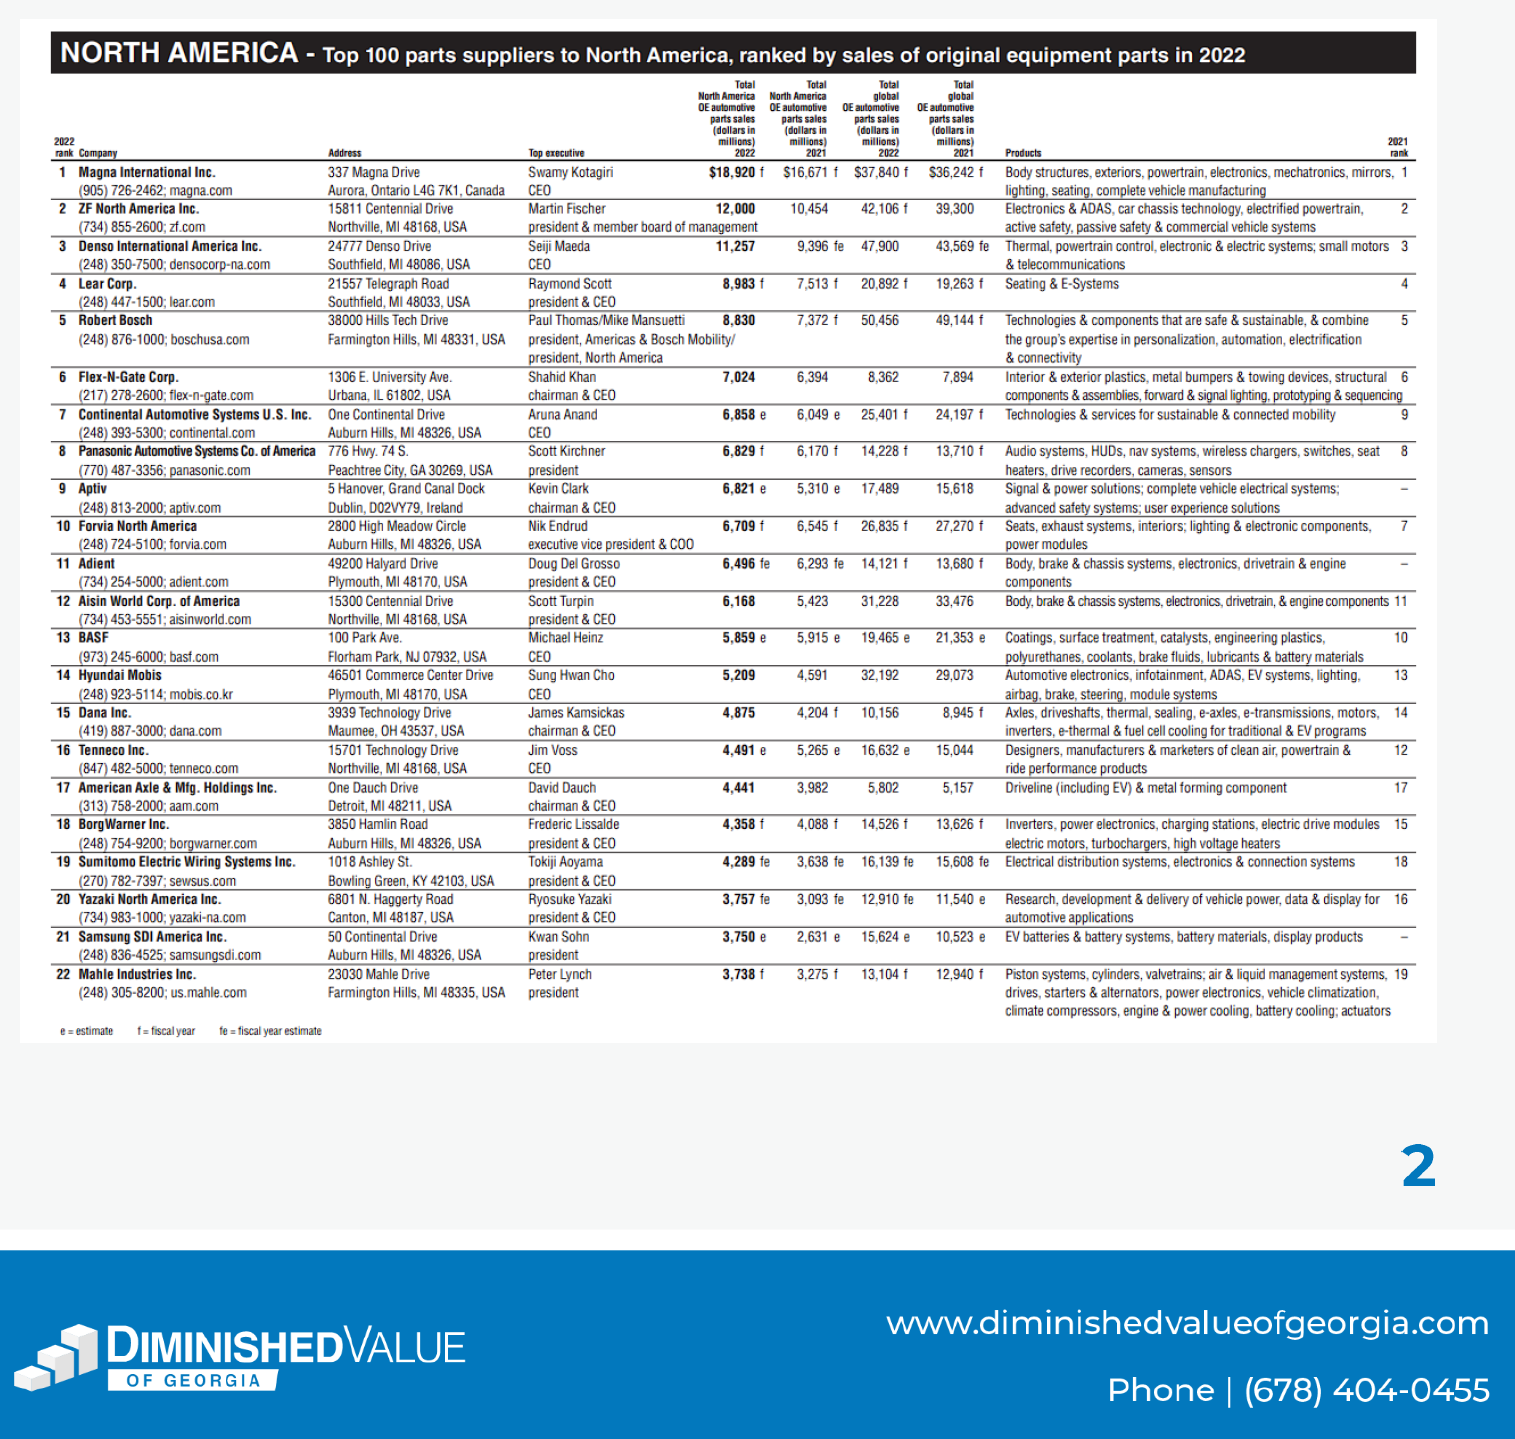
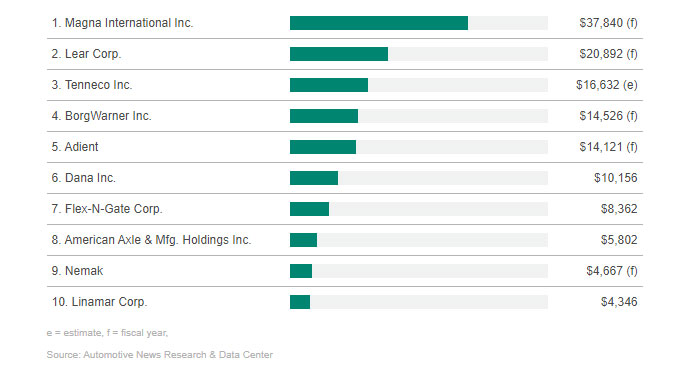
Automotive News published its annual ranking of the world’s largest original equipment suppliers based on 2022 sales in June this year. The following table shows the Top 10 North America-based auto parts suppliers from that list:

Click to enlarge

Source: Top suppliers: Giants grow larger, Automotive News

The tickers of some of the companies shown above are listed below:

  • Magna International Inc(MGA)
  • Lear Corp (LEA)
  • BorgWarner Inc (BWA)
  • Tenneco Inc (TEN)
  • American Axle & Manufacturing Holdings Inc (AXL)
  • Dana Holding Corp (DAN)
  • Adient PLC(ADNT)

Investors interested in adding exposure to this sector can use the above list as a starting point for further research.

Disclosure: Long MGA and ADNT

Eight Charts on the Australian Economy

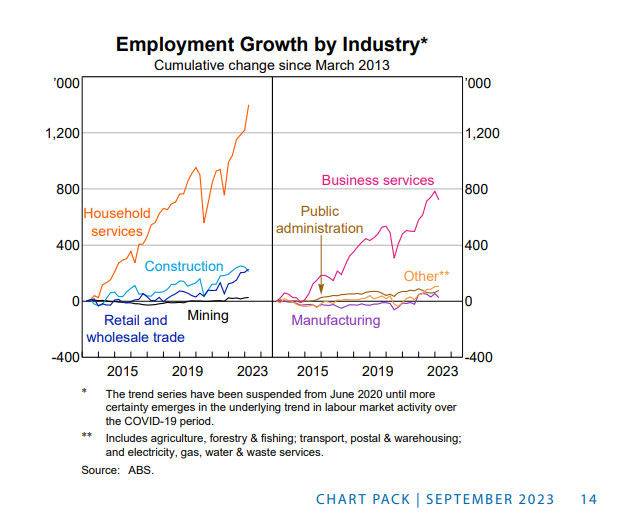
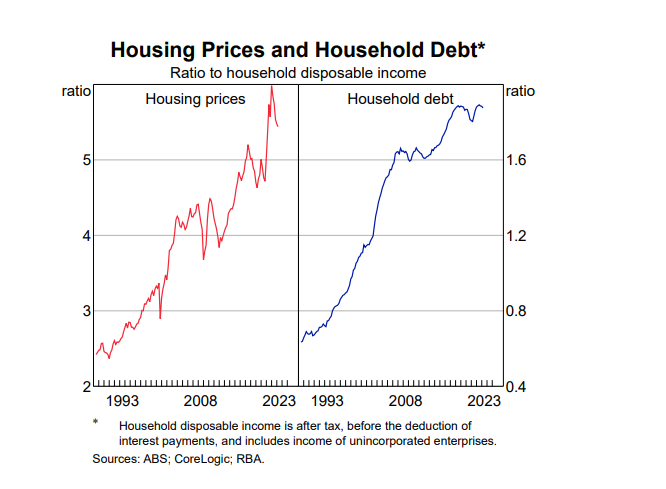
The Australian economy is one of the largest among the developed countries. With a GDP of about $1.5 Trillion the economy is smaller than the Canadian economy. Similar to Canada, Australia is also a resource-based economy. To put it another way, Australia mostly depends on simply digging up what’s under the ground and exporting to resource hungry countries such as China. The Reserve Bank of Australia published an excellent chart pack each month on the economy and financial markets. The following are select charts from the September edition of the report.

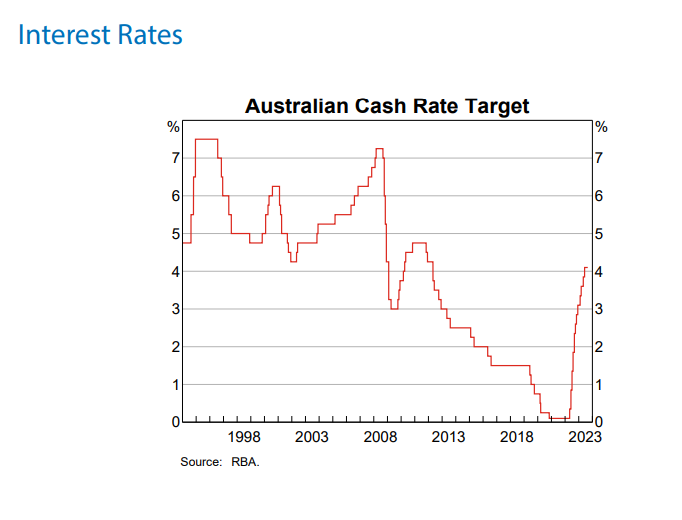
1.Cash Target Rate:

Similar to other developed countries, the Central Bank of Australia has increased interest many times from almost 0% and the cash rate has reached 4.10%.

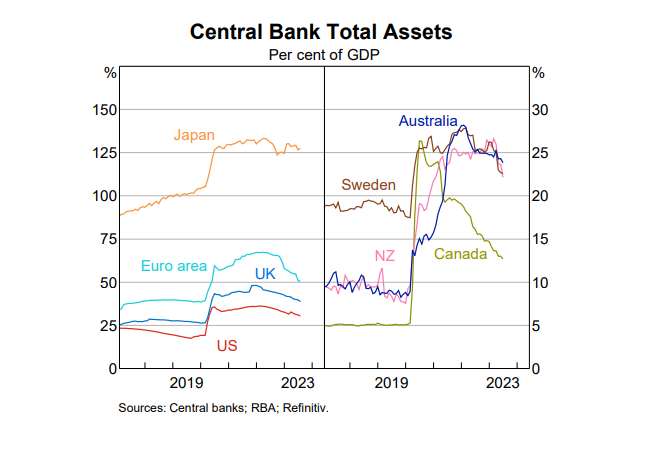
2.Central Bank Total Assets:

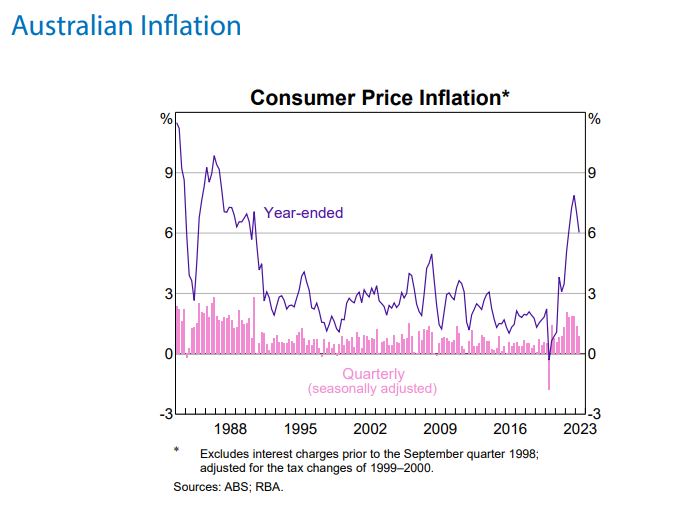
3.Consumer Price Inflation:

The official rate has started to decline from a peak 7.8% and has reached 6%.

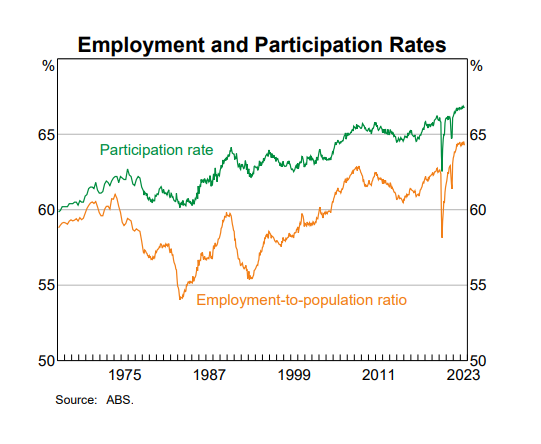
4.Employment and Participation Rates:

After dramatic declines during the covid-19 pandemic, labor participation rates have picked up strongly.

5.Employment growth by Industry:

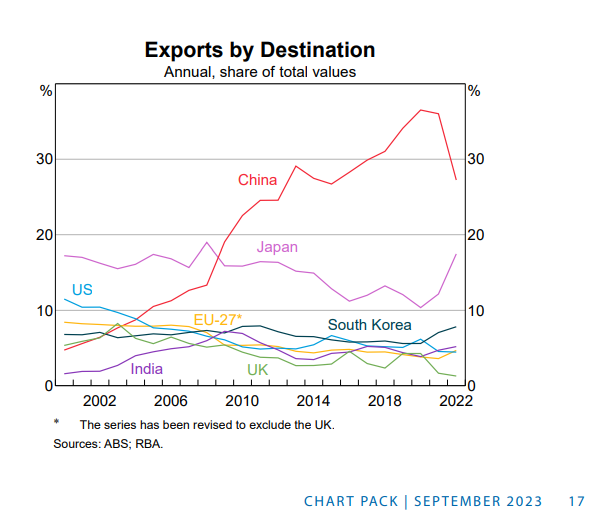
6.Exports by Destination:

China is the largest export destination for many Australian resources particularly iron ore. As China’s economy has stagnated, the demand for commodities has declined leading to the sharp decline in Australian exports to China.

7.Housing Prices and Household Debt:

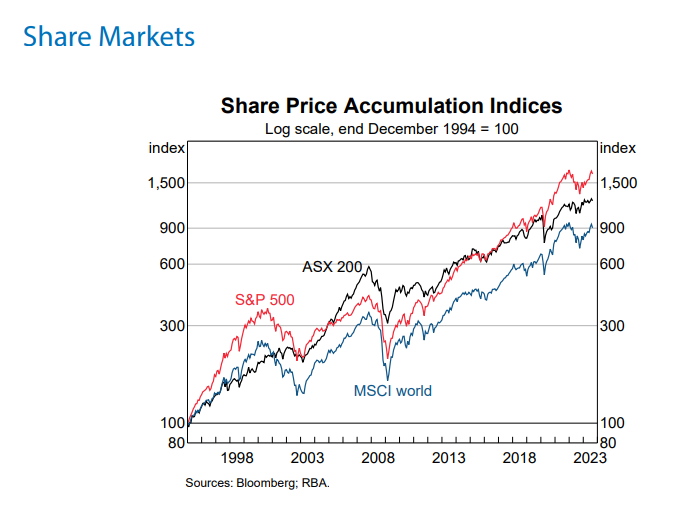
8.Australian Share Prices vs. US and World Share Prices:

Australian equities as represented by the ASX 200 has underperformed US stocks for many years now. Global decline in commodity prices and demand could lead to further underperformance in the future.

Source: The Australian Economy and Financial Markets Chart Pack | August 2023, Reserve Bank of Australia

The Top 100 Auto Parts Suppliers To North America 2023

Auto parts suppliers form a critical part of the automotive industry eco-system. Without the parts suppliers major auto makers would grind their operations to a halt. The auto parts suppliers make everything from electronic systems to seats and everything in between. The importance of the parts makers cannot be understated. For instance, airbag makers are vital to safety of passengers in any vehicle. From an investment point of view, I have always stated that parts suppliers are better than the auto makers themselves. Unlike auto makers, parts makers are not burdened with many legacy issues such as healthcare costs, pensions, etc. In addition, parts have to be replaced on a regular basis as part of maintenance and also consumers depend on new parts in times of recession as they tend to repair their cars and hold on to them longer.

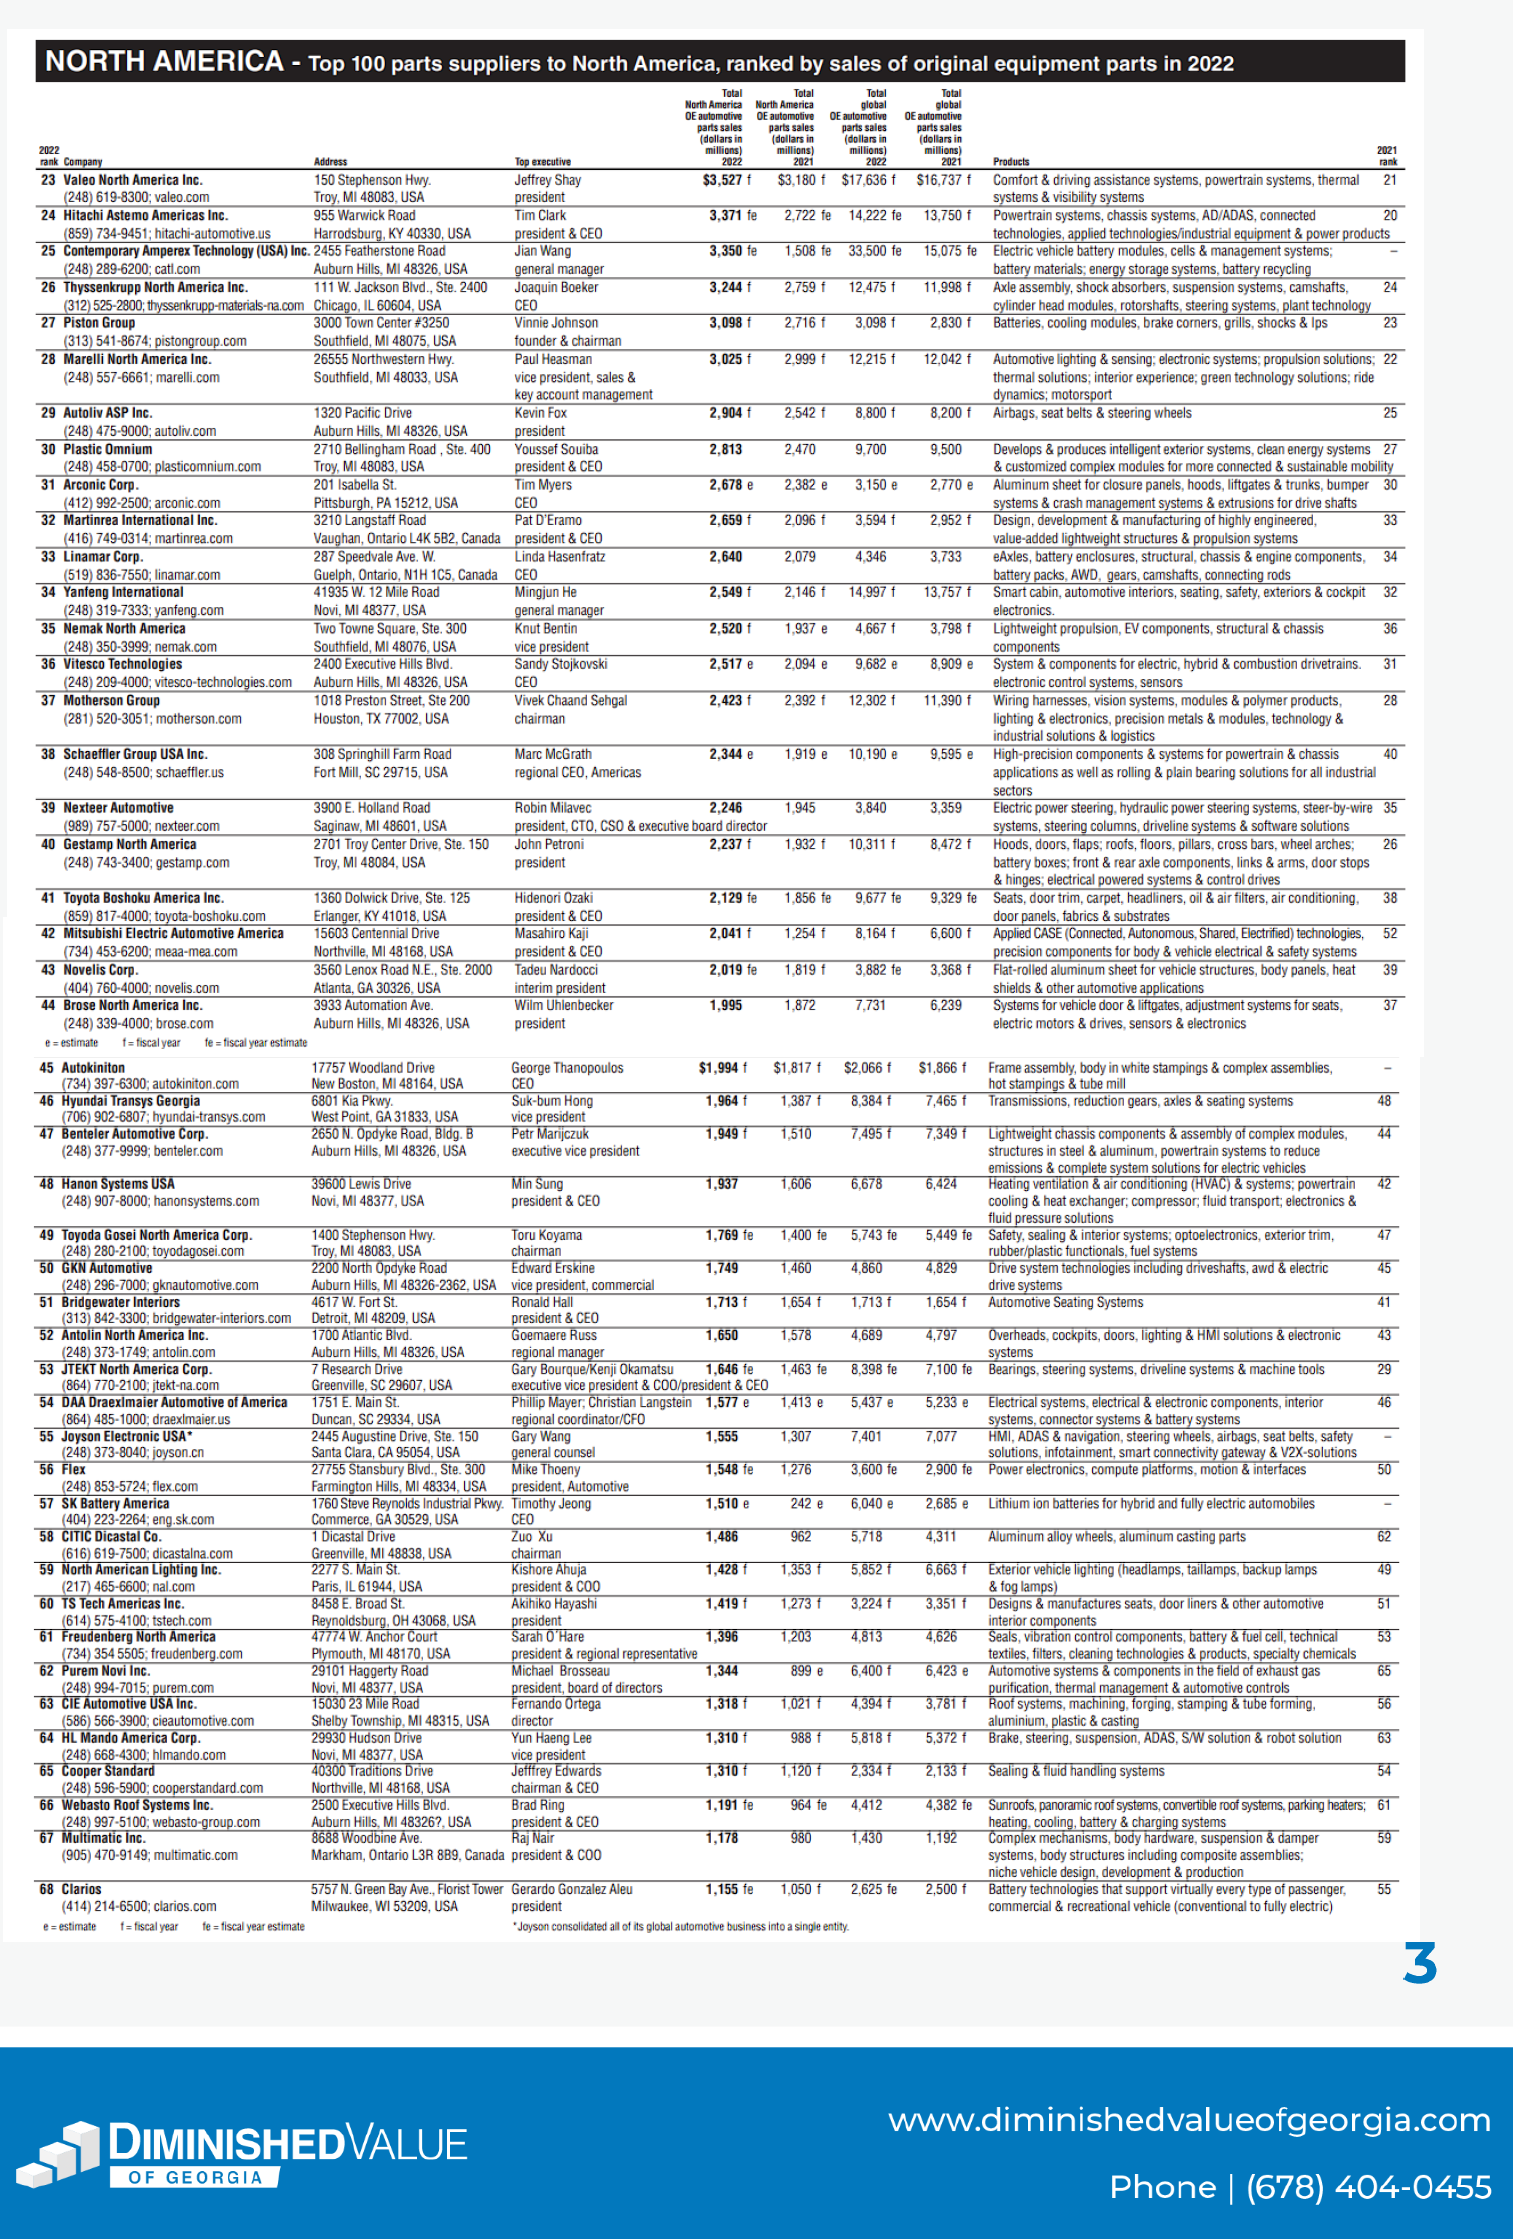
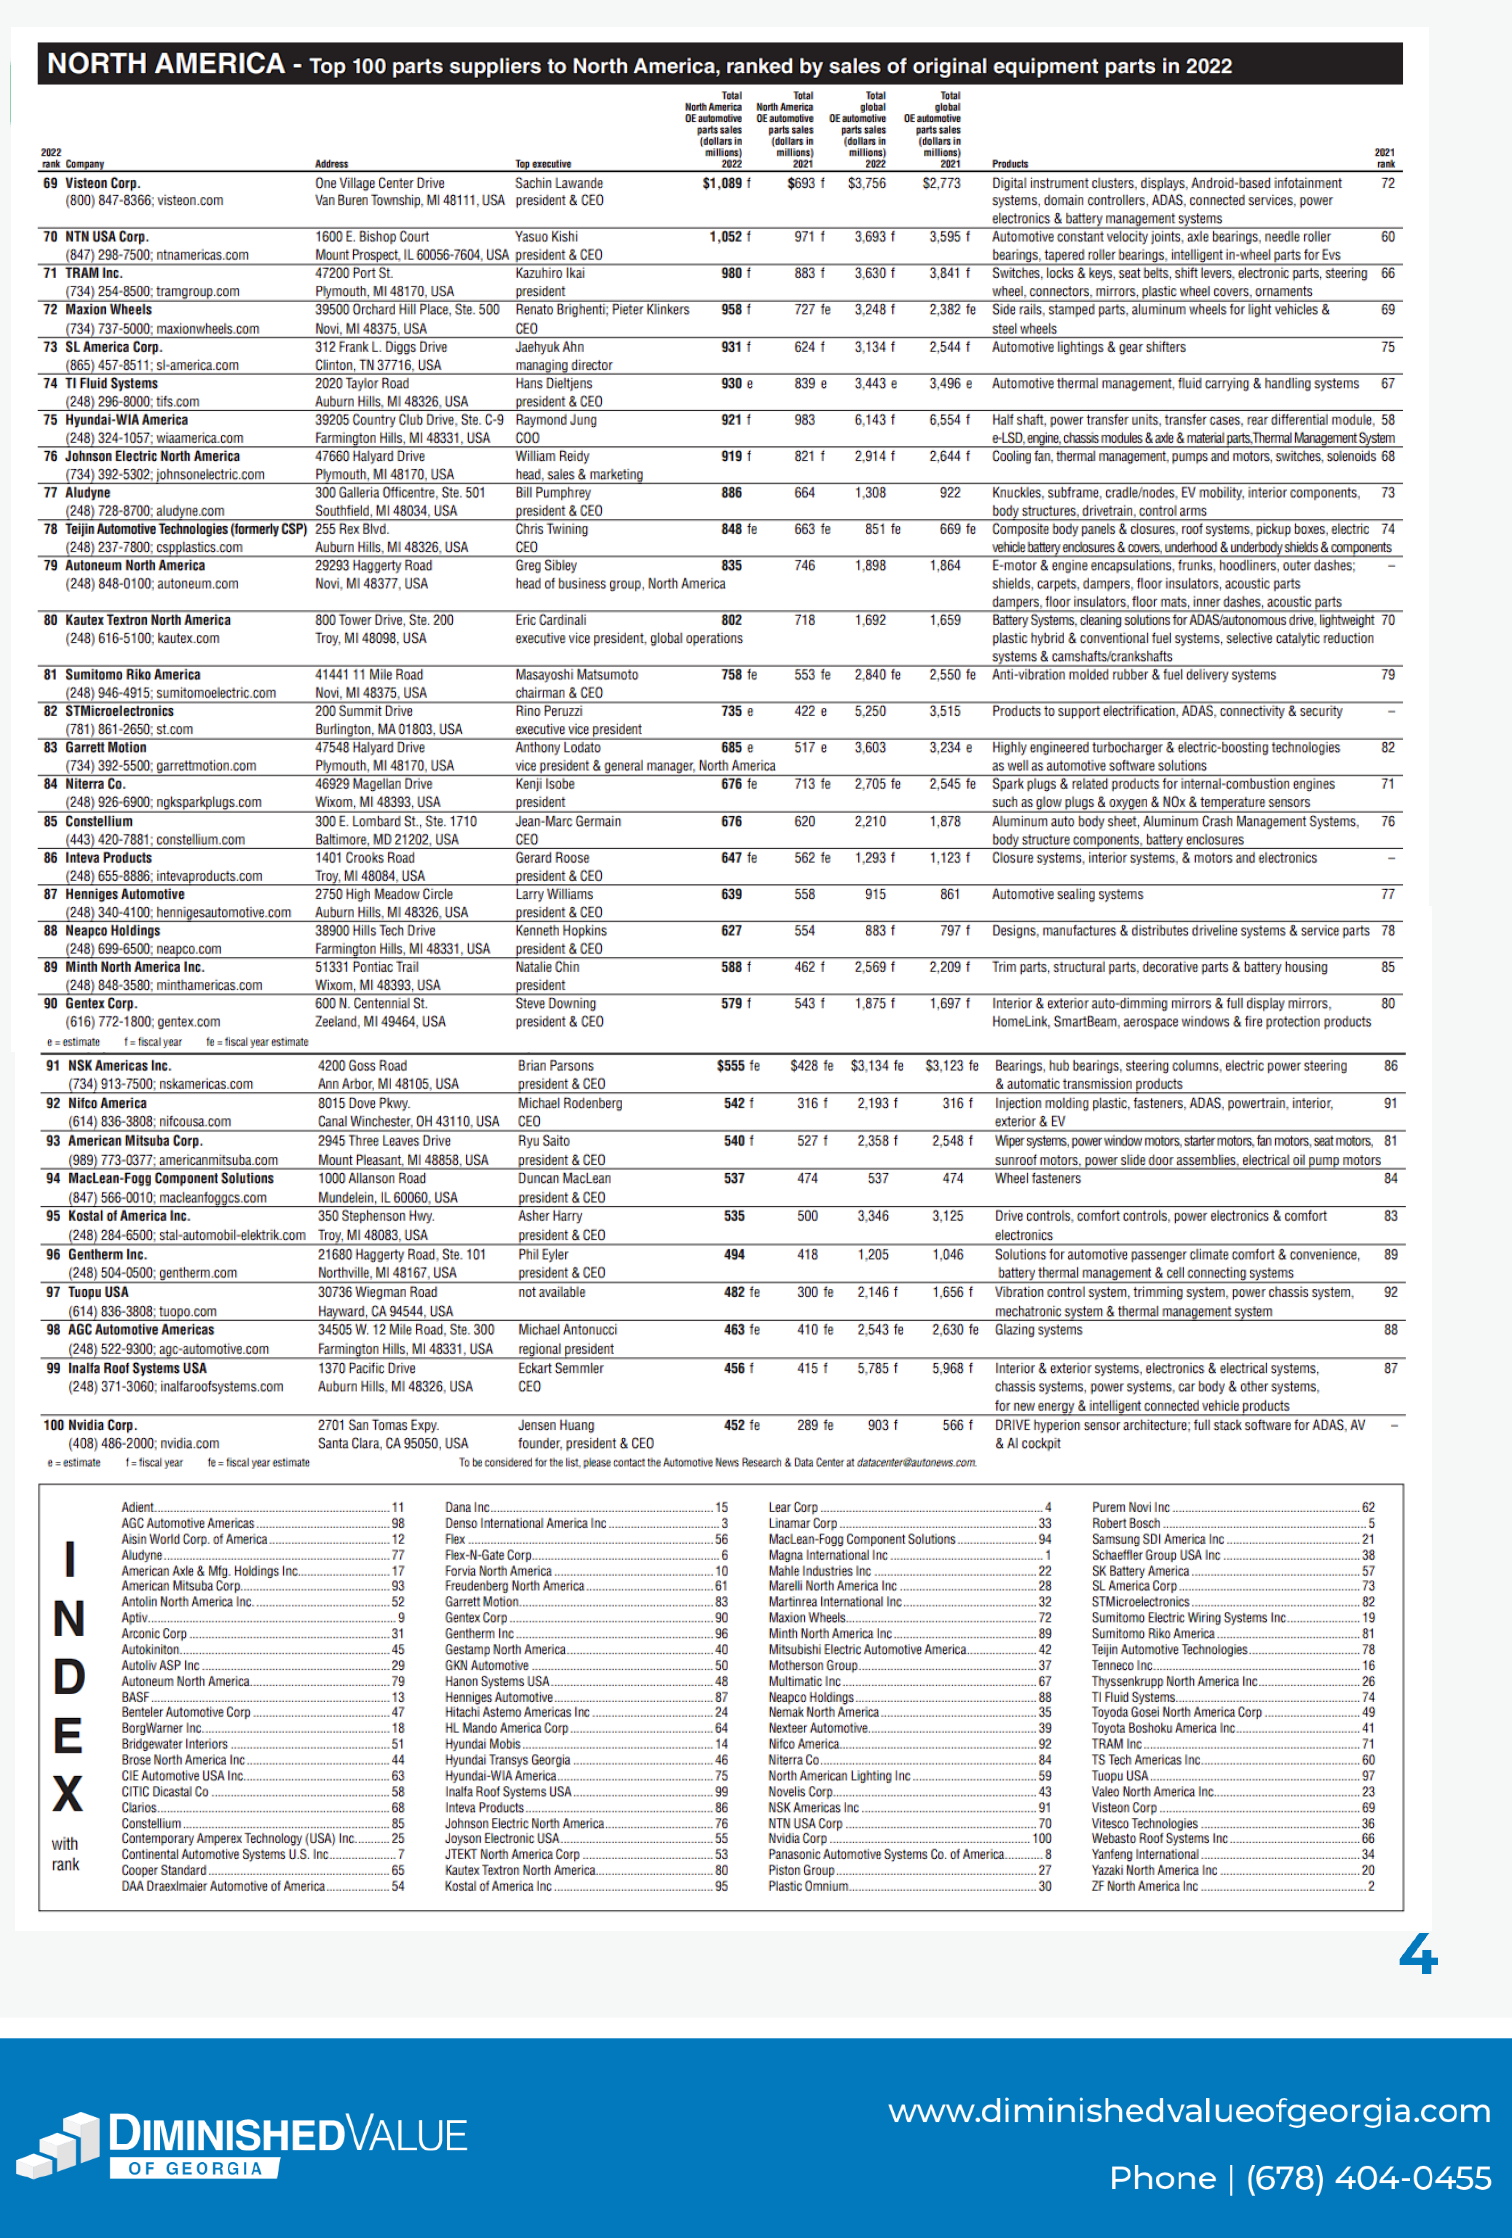
With that brief intro, let’s take a look at the top 100 auto parts suppliers to North America based on sales in 2022. Canada-based Magna International (MGA) ranked as the top player followed by ZF North America and Denso International America. Lear(LEA) took the 4th spot followed by Germany-based Bosch.

Click to enlarge

Source: Diminished Value of Georgia

Semiconductor giant Nvidia (NVDA) is the only chip company in the list above and was ranked 100th.

Disclosure: ADNT, ALV, MGA and CTTAY

On The Performance of Nasdaq-100 vs. S&P 500

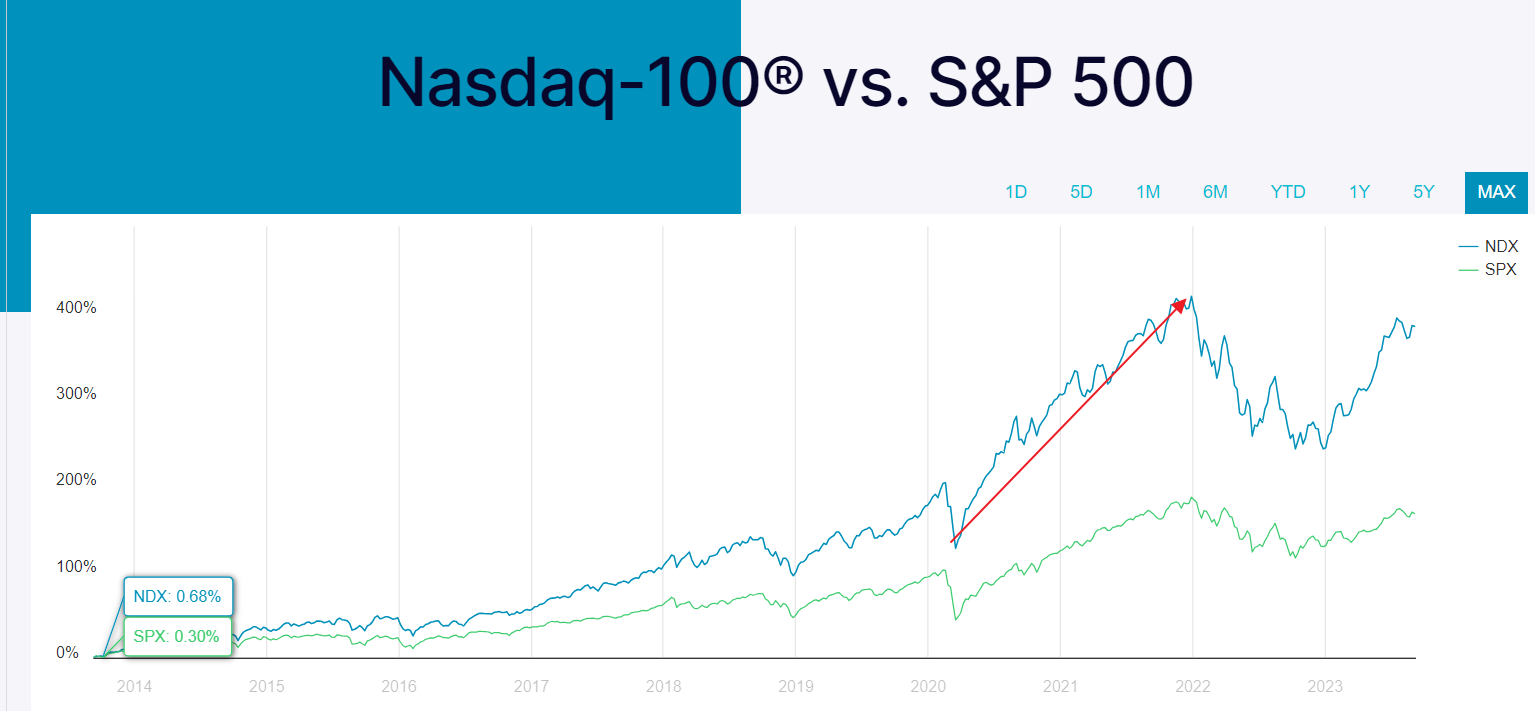
The NASDAQ-100 index represents the largest 101 non-financial companies listed on the NASDAQ exchange. It is a modified capitalization-weighted index. The S&P 500 index on the other hand is a free-float capitalization-weighted index is composed of the largest 500 companies trading on the US markets. The S&P 500 is more representative of the US economy while the NASDAQ index is heavily focused on technology. Since the tech sector has performed very well in the past few years, the NASDAQ-100 has outperformed the S&P 500 by a wide margin as shown in the chart below:

Click to enlarge

Source: NASDAQ

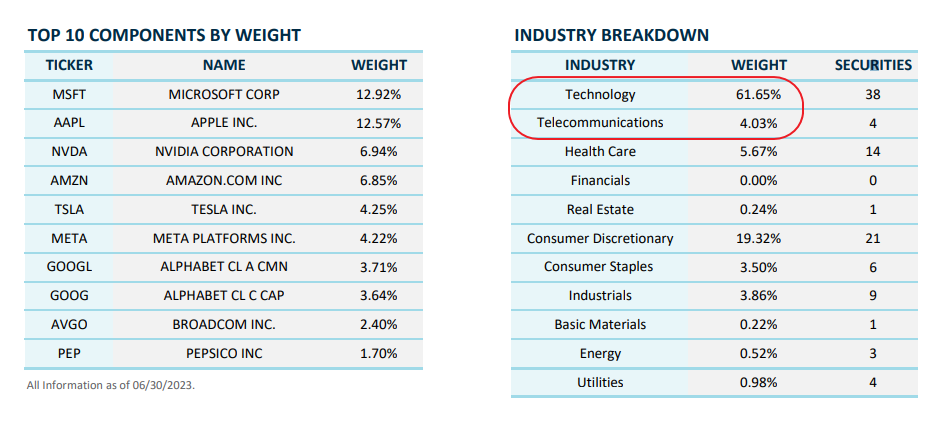
The following chart shows the sector composition of the NASDAQ-100:

Click to enlarge

Source: NASDAQ

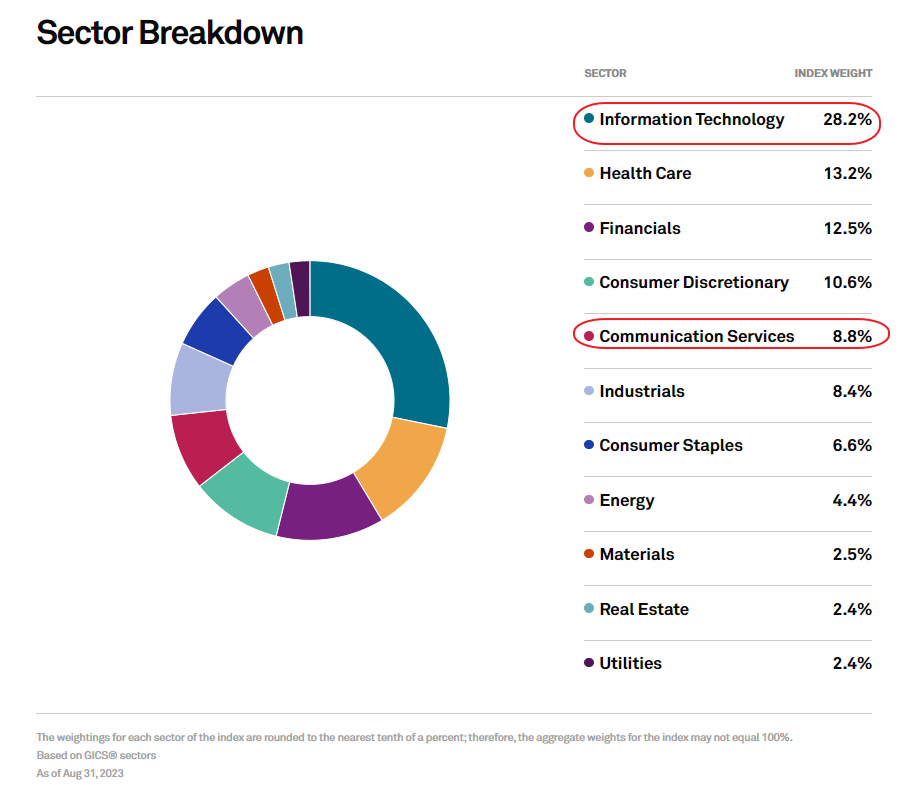
The the sector breakdown of the S&P 500 index:

Source: S&P

At the end of second quarter, tech sector accounted for about 62% of the NASDAQ-100. If we add Telecommunications the weightage increases further to 66%. In the S&P 500, tech’s weightage is 28%. Even with the addition of Telecom the total comes to just 37%. Thus the high allocation of tech in the NASDAQ index is helping fuel the huge rally.

Financials account for over 12% of the S&P 500 while it has no allocation in the NASDAQ-100. The crash in bank stocks this year has adversely impacted the S&P 500 while NASDAQ-100 remains unscathed.

Consumer Discretionary has a high allocation in the NASDAQ-100 at 20%. If the US economy goes into a recession this sector is bound to get crushed. In the S&P 500 it accounts for about 10%.

Overall though NASDAQ-100 is soaring this year relative to the S&P 500, risk remains high for NASDAQ stocks. So investors need to take that into consideration when making investment decisions.

Related ETFs:

  • SPDR S&P 500 ETF (SPY)
  • Invesco QQQ Trust Series (QQQ)

Disclosure: No positions