Volatility is normal in equity markets. The dramatic selloff that followed Brexit and the reversal in the past few days is a classic example of this phenomenon.
Even in good years stocks can experience gut-wrenching declines. Ultimately the annual returns or long-term returns matters most than dramatic declines in a short-time. The following table shows the annual returns and the intra-year declines of the FTSE All-Share Index:
Click to enlarge
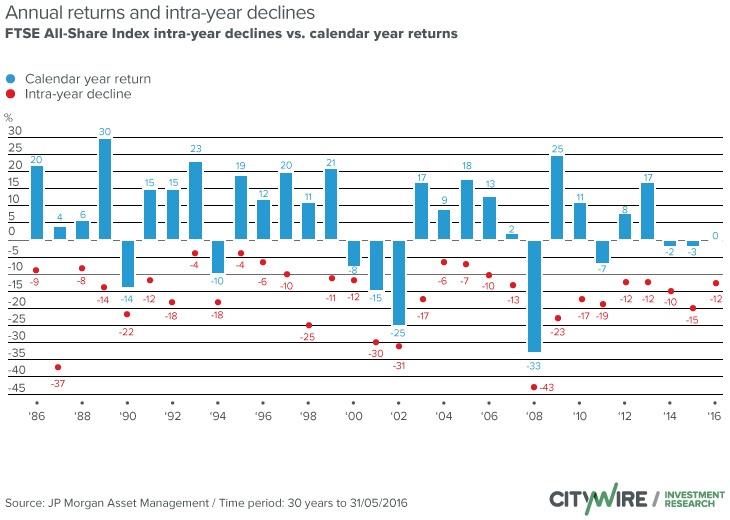
Source: Why ‘Brexit’ could be a blip in stock market history, Citywire UK
From the article:
The red dots in the chart show the maximum fall in each year since 1986, the bars the annual move in the All-Share index. Despite average falls of nearly 16% at some point the index delivered positive returns in 21 of the past 30 years.
So the key takeaway is investors should not get scared by sharp declines on specific days or even in a short time period. Stocks can swing wildly up and down during the course of a year. Selling out during the panics hoping to buy back is not a wise strategy.Instead of worrying about short-term price movements investors are better off focusing on their long-term goal and the investment return over a year or many years.