A Review of West African Regional Stock Exchange

The MSCI Frontier Markets Index includes from the countries that are less developed than emerging countries. Frontier markets include countries like Tunisia, Sri Lanka, Estonia, etc.

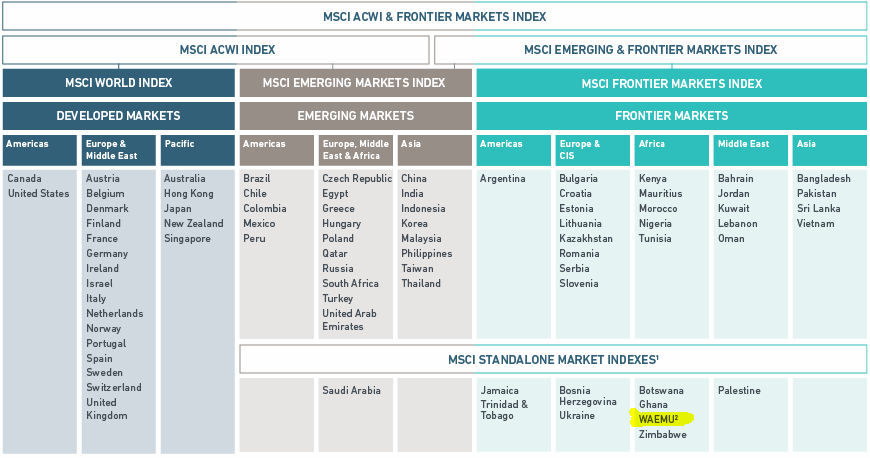
The MSCI classification of countries for the various indices they provide are shown in the chart below:

Click to enlarge

Frontier Markets Countries

Note:

2. The West African Economic and Monetary Union (WAEMU) consists of the following countries: Benin, Burkina Faso, Ivory Coast, Guinea-Bissau, Mali, Niger, Senegal and Togo. Currently the MSCI WAEMU indices include securities classified in Senegal, Ivory Coast and Burkina Faso.

Source: MSCI

I recently learned that the French-speaking countries in West African countries have their own common stock exchange called the West African Regional Stock Exchange from an article in The Wall Street Journal. The following are key points from that piece and my research:

  • The exchange is based in Abidjan, Ivory Coast.
  • The total market capitalization of the West African Regional Stock Exchange in 2015 was $15.B. Since 2010, the market cap has increased by 90%.
  • The Eight French-speaking countries also share a common currency called the CFA Franc.
  • Only 30 companies are listed on the exchange. But the composite rose 17.8% in 2015.
  • The market is very liquid. Only 4% of total listed equity were traded last year.
  • Some of the large companies listed on the exchange include the Senegalese unit of Total SA, Ivorian utility unit of Total SA  and the Ivorian units of Unilever NV and Nestlé SA.

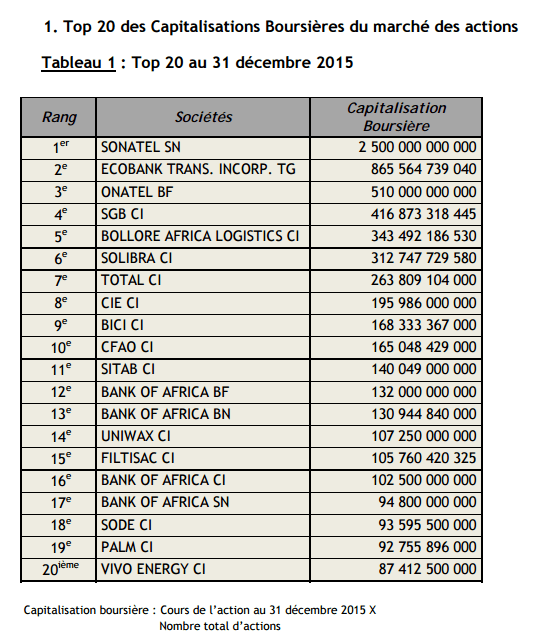
The top 20 companies by market cap as of Dec, 2015 are shown below:

West africa REgional Exchange-Top 20 Firms


Sources:

Big Number, WSJ, May 17, 2016

BVRM, Wikipedia

Companies listed on the Exchange, BVRM

West African Regional Stock Exchange Site

Related ETF:

  • iShares MSCI Frontier 100 ETF (FM)

Disclosure: No Positions

Map of the USA circa 1839

The current US map looks like this:

Click to enlarge

US Map

Source: Wikipedia

But back in the 1800s the country looked much different. All the states were not yet formed and many were simply grouped as territories. For example, the middle of the country had the “Indian Territory”.

The following is a cool map of the USA from 1839:

Click to enlarge

US and Texas Map from 1839

Source: University of Texas Libraries via Daily Infographics

The Astonishing Growth of China’s Per capita GDP

China is one of the largest economies in the world with a GDP of over $18.0 Trillion in 2015 based on Purchasing Power Parity. The Per capita GDP is $14,100 and that puts the country at 113 in the world according to CIA’s World Factbook.

The above stats do not however tell how far China has come in terms of economic growth. With a population of over 1.3 billion China used to be one of the poorest countries in the early 20th century. From a rural agricultural-based economy the country has grown exponentially in the past few decades. Though China follows Communism economic reforms helped to to lift millions of poverty.

I recently came across an interesting article by Professor John Ross, Senior Fellow at Chongyang Institute for Financial Studies, Renmin University of China on the economic growth of China. The following table shows the fastest growing economies 1978-2015:

Click to enlarge

Table 1

Top Fastest Growing Economies 1978-2015

From the article:

It is also particularly striking that of countries that have gained in per capita GDP compared to the US only a few have gained greatly. Since the beginning of China’s economic reforms in 1978 only six countries or regions with a population of at least five million have closed the gap on the per capita GDP of the US by at least 20% – Mainland China, Malaysia, Taiwan Province of China, Hong Kong SAR, Singapore, and South Korea. All six are in Asia. Of these Mainland China achieved the fastest per capita GDP growth of any country not only in 1978-2015 but over the total period 1950-2015. Four of these economies – the ‘Asian Tigers’ of South Korea, Singapore, Taiwan Province of China, and Hong Kong SAR – all starting from a far higher per capita GDP than Mainland China, have already achieved China’s goal of transition from a ‘low’ or ‘medium’ to a ‘high’ income economy.

Asia’s dominance in rapid growth economies is overwhelming. As Table 1 shows all 10 of the world’s fastest growing economics are Asian – indeed the top 13 are. It is therefore Asian economic development, not the Washington Consensus of the World Bank and IMF, which has been an overwhelming success. It follows that what China has to study to ensure it breaks through to high income status is not the dogmas of the World Bank but the forces which led to China’s own economy outgrowing all others and, after that, what forces produced rapid economic growth in Asia.

Between 1978-2015 China’s total GDP grew by nearly 1,400%. The annual growth rate was 7.4%. This growth rate is much higher than that of other countries including the Asian Tigers.

Indeed China has beat world’s top developed countries in economic growth during the period shown above. Mr.Ross explains the astonishing rate of China’s growth relative to developed countries.

China’s Per capita GDP growth at an annual rate was higher even when compared to advanced economies as shown in the table below:

Table 3

Per Capita GDP Select Countries

Another excerpt from his article:

Table 3 shows that this fundamental model has not changed. Taking the most important advanced economies over the period 1978-2015, annual average per capita GDP growth was 1.7% in the UK, 1.6% in the US, Germany and Japan, and 1.2% in France. China’s growth was approximately five times as fast as all these economies. The result was China’s catch up in terms of per capita GDP. It may also be clearly noted that the major advanced economies all had essentially the same per capita GDP growth rate of under two per cent – the maximum being 1.7% and the minimum 1.2%. As a result, over the period 1978-2015:

  • “China closed the gap in per capita GDP compared to the US from US per capita GDP being 30 times China’s to being four times.
  • China closed the gap in per capita GDP compared to Germany from Germany’s per capita GDP being 26 times China’s to under three and a half times.
  • China closed the gap in per capita GDP gap compared to the UK from 21 times to under three times.
  • China closed the per capita GDP gap compared to France from 25 times to under three times.
  • China closed the per capita gap Japan from slightly under 21 times to under three times”.

Source: To become a ‘high income’ economy China needs to study facts not myths. Key Trends in Globalisation, John Ross

While it is common knowledge that the Chinese economy is one of the fastest growing in the world, when looked at a long-term perspective it is fascinating to see the rate of solid economic progress.

The Top Global Container Shipping Companies

The global shipping industry is dominated by a few companies. With more mergers planned, the industry’s concentration among a few players is going to get bigger. The companies in the industry are huge and are critical to global trade as they operate container ships that transport from one part of the world to another. The world’s largest container operator is Denmark-based Maersk with a market share of about 15% of the total world market. All the major firms in this industry are part of one of the four alliances.

The world’s top container ship companies are shown in the graphic below:

Click to enlarge

The Top Global Shipping Companies

Source: Shipping Mergers to Remake Global Alliances, WSJ, April 12, 2016

The four alliances are 2M, Ocean 3, CKYHE and G6. Germany-based operators in the above list are Hamburg Sud and Hapag-Lloyd and CMA CGM is a French company.

It is interesting that just 14 top companies control about three-fourths of the global shipping market.

The world’s largest ship is the latest Triple-E class ships from Maersk. The first Triple-E class ship is Mærsk Mc-Kinney Møller shown below:

Click to enlarge

Mærsk Mc-Kinney Møller Ship

KONICA MINOLTA DIGITAL CAMERA

Here are some fascinating facts about this ship:

  • “At 400 metres long the Triple-E ships on order by Maersk Line are larger than any vessel of any kind currently on the water. Its capacity of 18,000 TEU is a significant increase on the current 15,500 TEU capacity of the Maersk E-class
  • Maersk Line’s largest ships currently sailing the world’s oceans are the Maersk E-class vessels, which are 396 metres long
  • Other known large vessels include the container ship Marco Polo (also 396 metres long), the super tanker Berge Emperor 380 metres), the cruise ship Allure of the Seas (361 metres), and the war ship USS Enterprise (341 metres)
  • The largest ship ever built was the super tanker Knock Nevis (458 metres). She was scrapped in 2010.The normal operation of the vessel will be similar to the manning of the Maersk E-class vessels (22 crew members). It is, however, possible to operate with a crew of 13. If needed, the vessel can accommodate 34 persons in total.
  • The height (above baseline) of Triple-E is 73 metres, slightly higher than Allure of the Seas (72 metres), which currently is considered the highest.
  • Other principal measures of the Triple-E include:- Beam (breadth): 59 metres- Draught: 14.5 metres- Deadweight: 165,000 metric tonnes- Reefer container capacity: 600- Top speed: 23 knots.”

Source: Maersk

The largest ship in the world requires just 22 or a minimum of 13 people to man it.

Update:

 The Top 10 Container Firms in December,2016:

Click to enlarge

top-10-container-firms-dec-2016

Source: WSJ

Global Auto Brand Owners: Infographics

The global auto manufacturing industry  is competitive with many players catering to every section of auto buyers. However the major players own the top brands. For instance, US-based General Motors (GM) owns the Buick, Cadillac, Chevrolet, GMC, Holden, Vauxhall and Opel brands, Germany-based Volkswagen (VLKAY) owns Audi, Bentley, Bugatti, Lamborghini, Porsche, SEAT, VW and Skoda, Indian auto-maker Tata Motors (TTM) is also the owner of iconic British-brands Jaguar and Land Rover.

The following graphic shows the major auto makers and their brands:

Global Auto Industry Graphic

Source: Car Industry Explained, Daily Infographics

Related:

Disclosure: No Positions