Gold Prices Since 1920: Chart

Gold is generally considered as an asset to hold against inflation. During periods of market volatility investors tend to flock to the yellow metal. Today gold for August delivery closed at $1,356 an ounce.

Over the course of many decades gold has seem dramatic rises and falls. The following chart shows the price of gold since 1920:

Click to enlarge
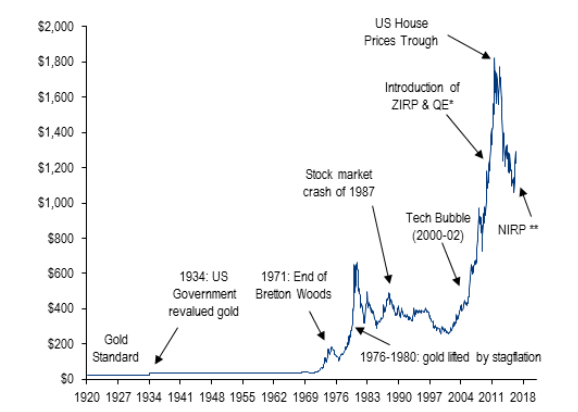
Gold Price Since 1920

Source: Five risk/reward charts that long-term investors need to bookmark, FE Trustnet

From the article:

The price of gold was fixed at $20 per troy ounce under the Gold Standard Act until 1933, then Roosevelt revalued it at $35 in the midst of the Great Depression under the Gold Reserve Act of 1933. The Bretton Woods Agreement set a system of fixed exchange rates for major currencies in gold terms in 1994 but the US abandoned this in 1971.

Gold moved from $100 to more than $660 between 1976 and 1980 because of stagflation, with the yellow metal’s bull market brought to an end by anti-inflationary monetary policy in the 1980s. However, gold is now much higher than it was then.

“Intense deleveraging and zero interest rate policies across the G7 fuelled another bull market in gold, pushing prices from $600 per ounce to a peak of $1,900 per ounce in September 2011,” BofA ML said. “Recent declines in tail-risk fears and the prospect of the end of QE in the US caused gold to plunge to a six-year low of $1,051 per ounce by the end of 2015.”

Related ETF:

  • SPDR Gold Shares ETF (GLD)

Disclosure: No Positions

Also see:

10 Latin American Stocks For Income Investors

The S&P 500 is up by 4% year-to-date.Many Latin American equity indices have easily outperformed the S&P 500. For example, Mexico’s IPC All-Share has increased by 6.4% and Brazil’s Sao Paulo Bovespa has grown by over 22%, etc. Brazilian stocks declined heavily last year and they have recovered with the political situation improving.

In addition to looking for growth-oriented stocks, investors can also consider Latin American stocks for dividends. While the S&P 500 has an average dividend yield of about 2%, many companies in the region have much higher yields. The following are 10 Latin American stocks with their ADR tickers and current dividend yields:

1.Company: Empresa Nacional de Electricidad SA (EOCC)
Current Dividend Yield: 2.34%
Sector: Electric Utilities
Country: Chile

2.Company: Banco Santander-Chile (BSAC)
Current Dividend Yield: 5.53%
Sector: Banking
Country: Chile

3.Company: Banco de Chile (BCH)
Current Dividend Yield: 4.53%
Sector:Banking

Country: Chile

4.Company: Braskem SA (BAK)
Current Dividend Yield: 6.38%
Sector: Chemicals
Country: Brazil

5.Company: Ultrapar Participacoes SA (UGP)
Current Dividend Yield: 3.08%
Sector: Oil, Gas & Consumable Fuels
Country: Brazil

6.Company: Itaú CorpBanca(ITCB)
Current Dividend Yield: 5.18%
Sector: Banking
Country: Chile

7.Company: Grupo Aval Acciones y Valores S (AVAL)
Current Dividend Yield: 4.94%
Sector: Banking
Country: Colombia

8.Company: Bancolombia SA (CIB)
Current Dividend Yield: 3.23%
Sector: Banking
Country: Colombia

9.Company:Coca-Cola Femsa SAB de CV (KOF)
Current Dividend Yield: 3.60%
Sector:Beverages
Country: Mexico

10.Company:America Movil SAB de CV (AMX)
Current Dividend Yield: 4.02%
Sector: Telecom
Country: Mexico

Note: Dividend yields noted above are as of July 8, 2016. Data is known to be accurate from sources used.Please use your own due diligence before making any investment decisions.

Disclosure: Long ITCB, BSAC, BCH and CIB

On the Decline in Market Value of Big Global Banks

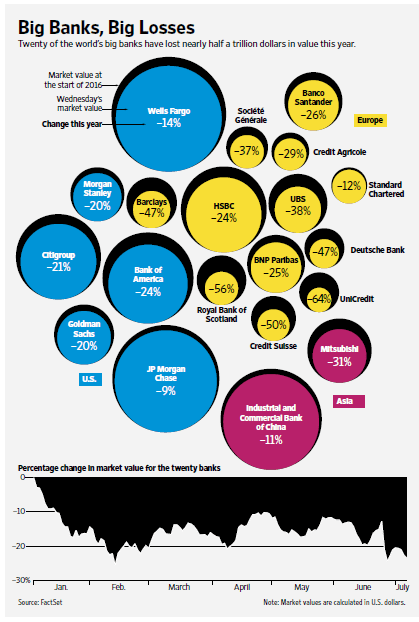
Some of the major European banks have seen their market values decline substantially this year. The STOXX® Europe 600 Banks Index is down about 33% year-to-date in Euro price terms. A few individual banks have lost much more. The following graphic from a recent journal article shows the serious damage to market capitalization of the world’s top 20 banks:

Click to enlarge

Big Banks Market Value Declines

Note: Data shown above is as of  July 6, 2016.

Source: Bank Market Values Crumple, WSJ, July 7, 2016

From the article:

The biggest market-value losers, in dollar terms, so far this year: Italy’s UniCredit has lost nearly two-thirds of its value; Royal Bank of Scotland has fallen around 56%; and Credit Suisse, Deutsche Bank and Barclays have all about halved.

Compared to European banks,US bank stocks are down by about 12% YTD as measured by the KBW Bank Index.

Among the foreign banks trading on the US markets, the top five with the worst returns YTD are:

  • Credit Suisse (CS): -51%
  • Royal Bank of Scotland (RBS): -50%
  • Lloyds Banking Group (LYG):  -37%
  • Mitsubishi UFJ Financial (MTU): -30%
  • Mizuho Financial (MFG): -30%

The top five banks with the best returns YTD are: Banco Bradesco(BBD), Itau Unibanco(ITUB), Banco Santander Brasil(BSBR) of Brazil, Banco Macro(BMA) of Argentina and BanColombia(CIB) of Colombia. All these banks are up 29% to 83%.

Source: BNY Mellon

Disclosure: Long CIB, BBD and ITUB

21 Incredible uses for Silver: Infographic

The precious metal Silver has many important uses in the modern world. Unlike gold Silver does not get much of media’s attention. This year Silver has jumped 47% beating gold which has risen 27% so far. Earlier this week the price of Silver rose 7% to reach $21 an ounce according to a news report.

I recently came across the below infographic showing the many uses of Silver. Like myself, many people may not be aware of the incredible uses listed here.

Click to enlarge

Incredible-uses-for-silver

Source: 21 Incredible Uses for Silver, Bullion Vault

Related ETF:

  • iShares Silver Trust (SLV)

Disclosure: No Positions