The development of health-tracking technologies is changing the way people monitor their health and perform physical activities such as exercise, jogging, running, weight-lifting, yoga, etc.
I came cross the following cool infographics that shows how health gadgets are changing our lives:
Click to enlarge
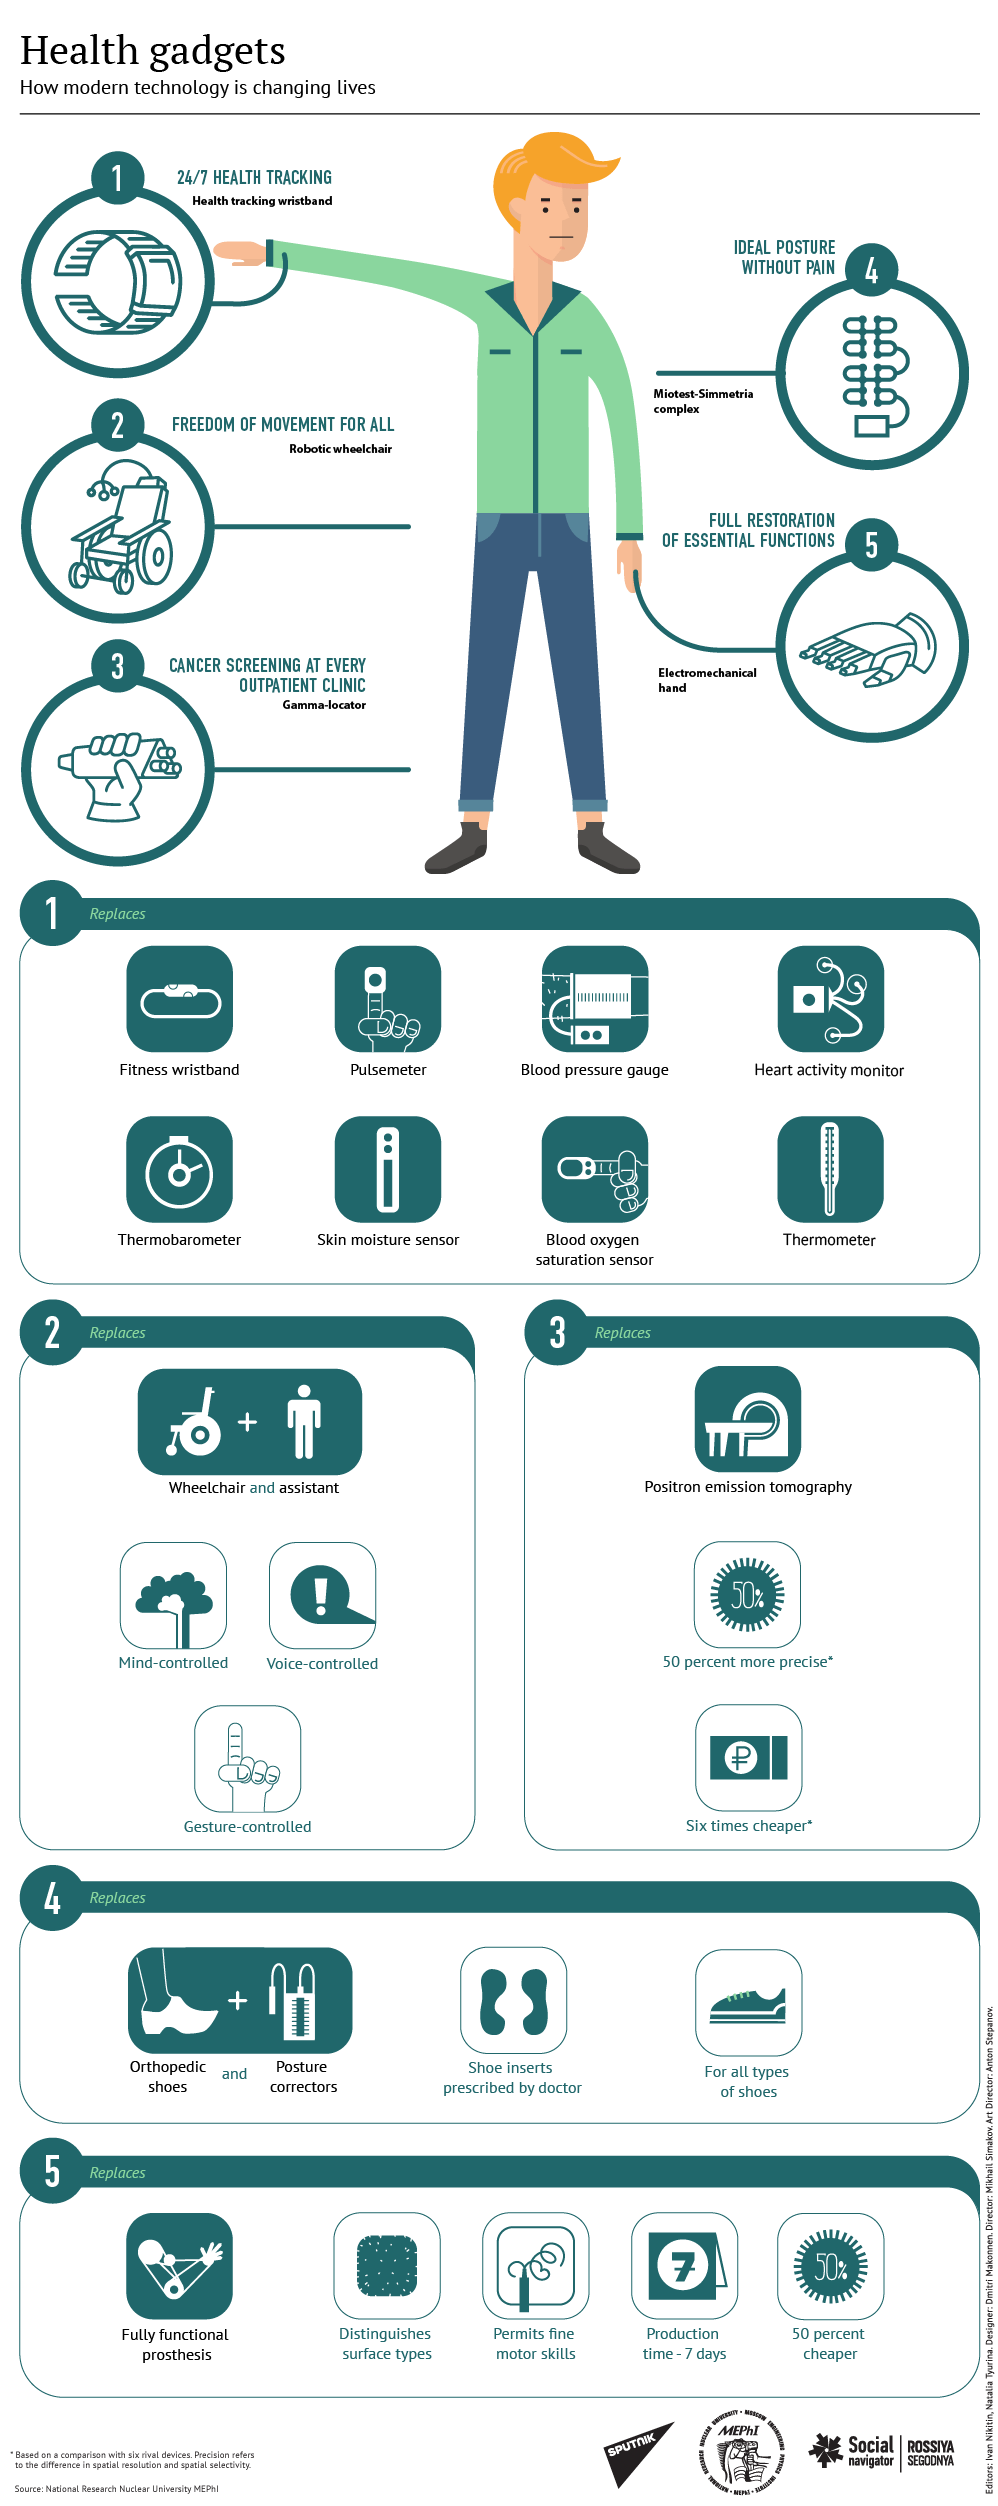
Source: Sputnik