Why Are US Bank Stocks Soaring

Bank stocks in the US have been in doldrums for many years now since the Global Financial Crisis(GFC). Investors mostly avoided them as a mountain of new regulations and ultra-low interest rates pressured their earnings quarter after quarter. But with the dramatic victory of President-elect Trump bank stocks have soared. In the two days since the victory banks have rocketed to record highs.

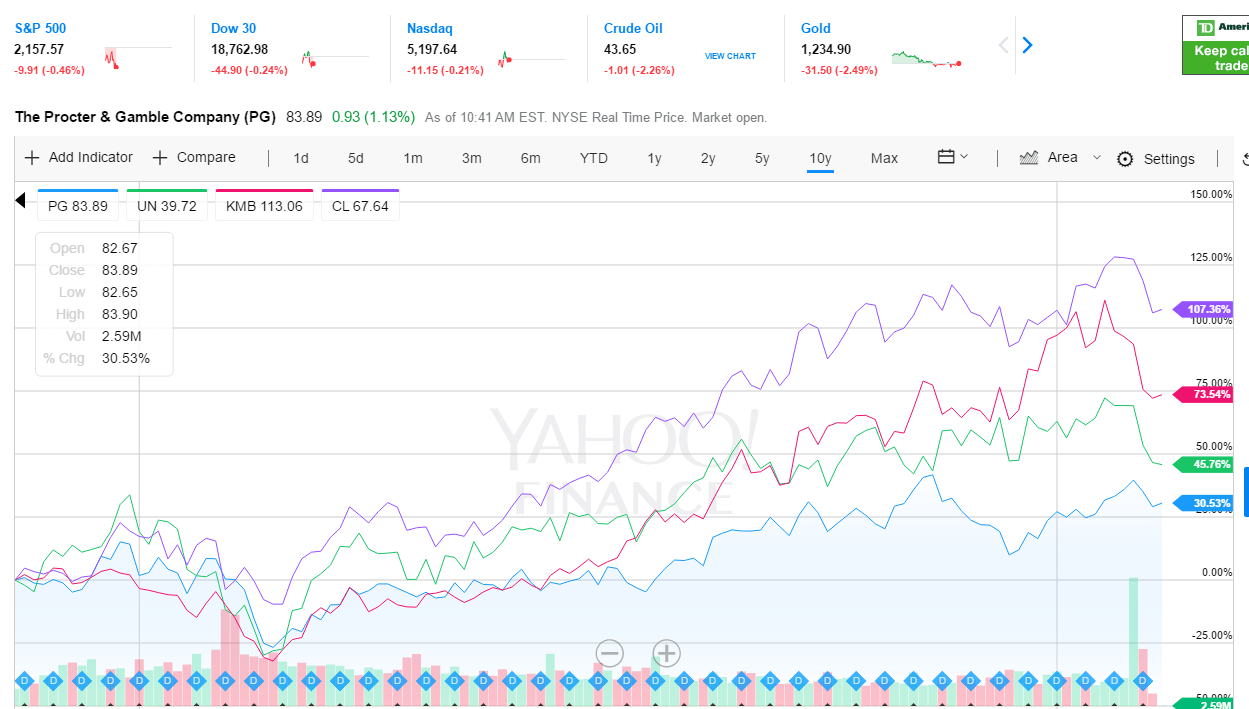
The chart below shows the jump in the KBW Nasdaq Bank Index which is the proxy for banks:

Click to enlarge

kbw-bank-index-returns-ytd

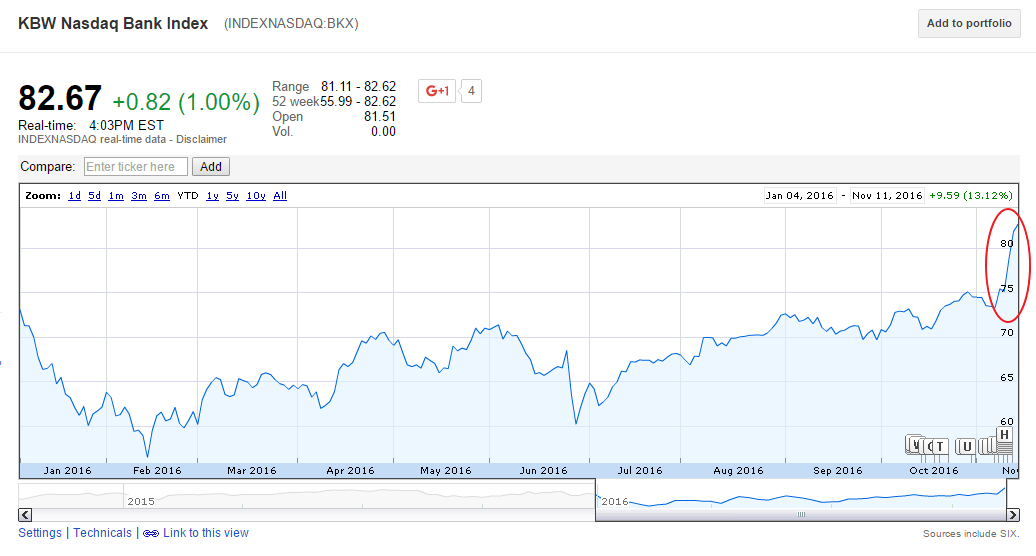
Source: Google Finance

As of market close Nov 10th, while the S&P 500 was up by 6% year-to-date  the KBW Bank Index has shot up by 12%.

Three of the main factors that favor bank stocks now include:

  • Elimination or weakening of the Dodd-Frank rules implemented after the crisis,
  • The Federal Reserve raising the interest rate sooner rather than later.
  • Significant reductions in the power of the Consumer Financial Protection Bureau (CFPB)

Among the hundreds of banks publicly-listed regional and community banks are poised to benefit the most under President Trump’s administration.

The complete list of bank stocks trading on the NYSE can be found here.

The complete list of bank stocks trading on the NASDAQ can be found here.

Two Reasons Why The FTSE-100 Has Outperformed Other Major Equity Markets

The British equity market as represented by the FTSE 100 Index has outperformed other major stock indices of this world so far this year. For instance, the S&P 500 is up 6% year-to-date. The main European indices have performed as follows:

UK’s FTSE 100: 9.4%
France’s CAC 40: -2.3%
Germany’s DAX Index:-1.1%
Spain’s IBEX35 Index: -8.3%

Note: Figures noted above are as of Nov 11, 2016

Compared to other developed indices of Europe the FTSE 100 has had an excellent run. So why did the FTSE perform so well relative to other major markets?

Two main reasons stand out in the answer to the above question. They are exposure to emerging markets and currency.

The FTSE 100 is the most exposed to emerging markets of all the major global indices. Multinational firms in the FTSE-100 generate about 27% of their revenues from emerging countries. The S&P 500 on the other hand earns only 10% from those markets. So as emerging markets have done well this year the FTSE has done well also.

One of the main impacts of the Brexit vote a few months ago was on the British pound. The pound has depreciated in value against other currencies. As a result a weaker pound makes the earnings of British companies from foreign countries  look bigger to investors who bid up shares.

So the key point to remember is that a bet on the FTSE-100 is actually more of a bet on the performance of emerging markets. I have noted many times before on this blog that big British companies have substantial operations in many emerging markets due to their deep roots there from the colonial periods.

Five FTSE-100 components are listed below with their current dividend yields:

1.Company:Diageo PLC (DEO)
Current Dividend Yield:3.06%
Sector: Alcoholic Beverages

2. Company: AstraZeneca PLC (AZN)
Current Dividend Yield: 4.94%
Sector: Pharmaceuticals

3..Company: Vodafone Group PLC (VOD)
Current Dividend Yield: 5.65%
Sector: Wireless Telecom

4.Company: British American Tobacco PLC (BTI)
Current Dividend Yield: 4.12%
Sector:Tobacco

5.Company: GlaxoSmithKline (GSK)
Current Dividend Yield: 4.95%
Sector: Pharmaceuticals

Note: Dividend yields noted above are as of Nov 11, 2016. Data is known to be accurate from sources used.Please use your own due diligence before making any investment decisions.

Disclosure: No Positions

Comparing Procter & Gamble Stock To Competitors

One of the important strategies for success in building wealth with equities is to identify and own the right the stock in an industry. Owning the average or poor player in an industry will lead to lower returns for investors. In this post, let’s put this logic to test.

US-based Procter & Gamble Company (PG) is a giant in the consumer staples sector. Some of its competitors are Colgate-Palmolive Company(CL), Kimberly Clark Corp (KMB) and Unilever N.V(UN).

In terms of stock performance, PG has under-performed the above competitors in the past 10 years as shown in the chart below:

Click to enlarge

pg-vs-peer-stock-returns

Note: Data shown above are as of  Nov 11, 2016

Source: Yahoo Finance

A few observations about Procter & Gamble:

  • PG returned 30% in terms of price appreciation in 10 years. Competitors CL, KMB and UN on the other hand yielded returns of 107%, 73% and 45% respectively. An investment in Unilever would have earned more than 50% returns than that of P&G’s return. The other two companies performed even better.
  • While all three- PG, CL and KMB are American firms, owning the right company increased the return earned by an investor was much higher in the the long-run.
  • In terms of dividend yields, PG currently yields 3.23%. CL, KMB and UN have dividend yields of 2.32%, 3.28% and 3.51% respectively.
  • PG has the largest market cap among these firms with a market cap of over $223.0 billion. However in terms of stock return especially in the long-run bigger size does not necessarily mean better returns.
  • Since 1970, PG stock has had 6 splits with the last 2 for 1 in 2004. An investment of $10,000 in PG stock 10 years ago would have grown to $17,673.35 as of Nov 10, 2016 for an average annual return of 5.86% according to stocksplithistory.com site. In 10 years the investment had a Total Return of 76%. Basically even in a decade the original investment did not double.

Click to enlarge

pg-stock-return-with-dividends-reinvested

Source: stocksplithistory.com

However its peers fared as noted below during the same time period:

CL:
Total Return – 161%
Average Annual Total Return – 10.08%

KMB:
Total Return – 152%
Average Annual Total Return – 9.70%

UN:
Total Return – 116%
Average Annual Total Return – 8.03%

The reasons for the poor performance for PG are many.Some of them are incompetent management, lack of innovation, bad acquisitions, giant bureaucracy, etc.

Also checkout:

Disclosure: No positions

Knowledge is Power: Monopsony, Coal, Anti-Globalization Edition

For Reference:

zoo-bird-photo

The Top 50 Global Pharma Companies 2016 By Sales

The Pharmaceutical Executive magazine published its 16th annual ranking of the Top 50 Pharma Companies Worldwide for 2016 based on sales revenue in 2015. This list can be used as a starting point for investors looking to research into global drug companies.

The Top 50 Global Pharma Companies for 2016 are listed in the tables below:

Click to enlarge

top-50-global-pharma-firms-tabe-1

top-50-global-pharma-firms-tabe-2

top-50-global-pharma-firms-tabe-3

top-50-global-pharma-firms-tabe-4

Source: Pharmaceutical Executive

Related:

Earlier:

None of the top 10 global pharma companies are from emerging countries.However two companies from those markets – one each from India and South Africa –  have made it to this list.