The U.S. expenditures on defense is higher than any other country in the world. The incoming Trump adminstration plans to spend even more to make America great again. Directly and indirectly the weapons and related-industries employs millions of people in the country provoding them high-quality well-paid jobs. Among the top 10 defense contractors, the top five get one-fourth of Defense Department funds according to a recent article in The Wall Street Journal. The top 10 companies that are likely to gain from higher defense spending are shown below:
Click to enlarge
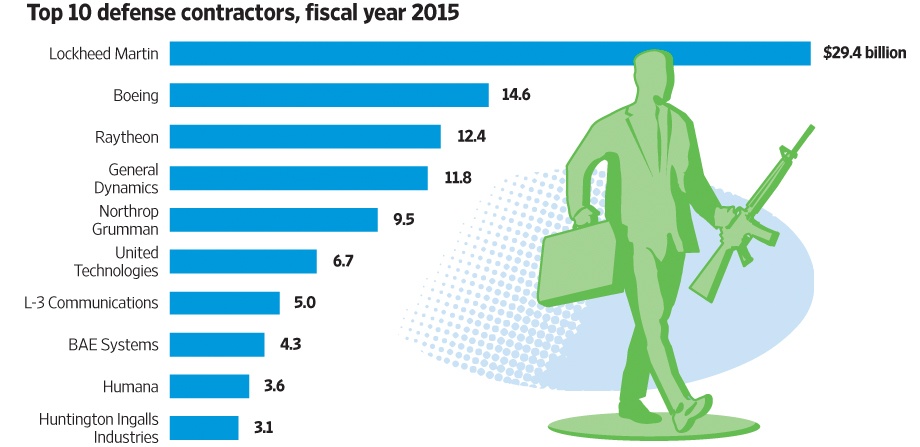
Source: Who Would Gain From More Defense Spending?, WSJ
The tickers of the top five companies in the above graphic are shown below:
- Lockheed Martin Corporation(LMT)
- Boeing Co(BA)
- Raytheon Company (RTN)
- General Dynamics Corporation (GD)
- Northrop Grumman Corporation (NOC)
Disclosure: No positions