On The Issue Of Home Bias Of Stock Market Investors

One of the factors that affects investors in the construction of a equity portfolio is the issue of home bias. Because of this issue investors to tend to avoid investing in foreign stocks.

An investor building a globally diversified portfolio must allocate assets based on the market-cap weighting of each country in a broad global index such as the the MSCI All Country World Index. To put it another way, if a country has a 5% market weighting in this index then an investor must invest of 5% of his/her portfolio in that country to truly achieve the benefits of diversification. However many investors have a home bias due to which they tend own more stocks from their own country than the market-cap weighting in an index.

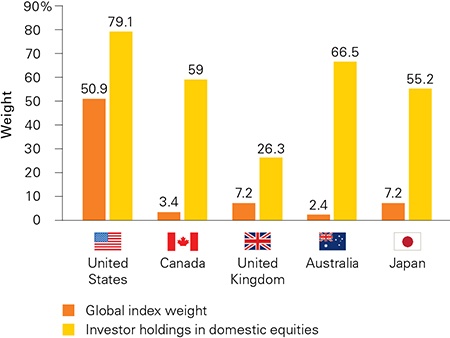
The chart below shows the home bias of equity investors in select countries:

Click to enlarge

Source: The global case for strategic asset allocation/home bias, Vanguard UK

The chart shows that though US accounts for only about half of the weighting in the global index, American investors own about 79% of their portfolio assets in domestic equities. So they own more than what is suggested by the global index. Hence US investors may lose out on gains from foreign stocks since they own less of them.Similarly Canadians own 59% of their portfolio in domestic stocks when the country accounts for about 3% in the global index. So they are over exposed to the local market.

Some of the factors that influence investors in owing foreign stocks are shown below:

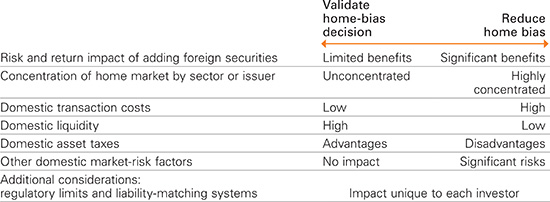
In general, it is not easy to overcome home bias.Most investors feel comfortable with the companies they know and are more familiar with than foreign companies. Moreover they may also use products of companies that are easier to access in the domestic market than some unknown company in a faraway land. For example, an average American may know popular companies Johnson&Johnson(JNJ), Starbucks(SBUX), Alphabet(GOOG), Home Depot(HD), General Mills(GIS), etc. than most of their foreign peers. Some of the foreign peers are firms like GlaxoSmithKline (GSK), Unilever PLC (UL), Nestle SA (NSRGY), UK-based Whitbread plc – owner of Costa Coffee(WTBCY), etc.

Disclosure: Long GIS

Household Savings Rate: U.S. vs. Australia

The savings rate in Australia is much higher than the U.S. rate. In the U.S., the Personal Saving Rate stood at just 6.0% as of October, 2016. This rate is the same as the household savings rate in Australia.

Click to enlarge

U.S. Personal Saving Rate:

Source: Federal Reserve of St.Louis

In the 60s and 70s, the savings rate hovered over 10%. However since then Americans have been saving less and less each year as the country turned into a consumption-driven economy.

Australian Households’ Savings Rate:

Source: A dash of data: Spotlight on Australian households, OECD Insights, OECD

The Australian Households’ Savings Rate was 15.8% in Q1, 2016. The average rate is 16.2%. This is one of the highest among OECD nations. During the global financial crisis of 2008-09, the savings rate rose sharply to 19% according to the OECD.

So Australian households save nearly three times more than American households. This is indeed surprising since Australians have a much stronger safety net than Americans and hence they can afford to spend more than save. But cultural factors and decades of relentless marketing to consume material goods has forced us to spend for the present than save for the future. It is imperative that the US savings rate continues to rise and reach and stay above 10% like in the past. However currently most people have no incentive to save due to little or no interest earned on bank deposits.


GDP Per Capita: Emerging vs. Developed Markets

Emerging markets such Brazil, China, India, Russia,etc. have had overall strong economic growth in the past few decades.However despite the tremendous increase in the standard of living in these and other emerging countries, the GDP per Capita is still far lower than those of developed countries.

Click to enlarge

Source: Emerging-Market Equity 2017 Outlook, Franklin Templeton Investments

The GDP per capita of the BRICs are less than $10,000 which is far lower than that of the US or Germany for instance. Hence emerging countries have still a long way to go to catch-up with the developed world. When they reach that point, they would no longer be emerging markets. Mark Mobius of Franklin Templeton predicts strong economic growth over the long-term for emerging markets.

Related article:

Related ETFs:

  • iShares MSCI Emerging Markets ETF (EEM)
  • Vanguard MSCI Emerging Markets ETF (VWO)

Disclosure: No Positions

Knowledge is Power: Canadian Charts, American Tragedy ?, New Dividend Strategy Edition

Amusement Park, Blackpool, UK

U.S. Firms Dominate The Global Weapons Industry

The global arms trade is a multi-billion dollar industry. According to Stockholm International Peace Research Institute (SIPRI), the sales of weapons and military services by the world’s largest 100 arms-producing and military services companies (“SIPRI Top 100”)  totaled $370.70 billion in 2015.

Of the SIPRI Top 100, more than half of arms sales worldwide come from American companies:

Click to enlarge

Source: SIPRI

The Top 10 companies in the SIPRI 100 are shown in the graphic below:

Click to enlarge

Top-100-Arms-Producing-Companies-Year 2002-2015

Source: Daily Infographics

The U.S. firms shown in the above chart are:

  • Lockheed Martin Corporation (LMT)
  • Boeing Co (BA)
  • Raytheon Company (RTN)
  • Northrop Grumman Corporation (NOC)
  • General Dynamics Corporation (GD)
  • United Technologies Corporation (UTX)
  • Level 3 Communications, Inc (LVLT)

The European firms shown above are listed below with their tickers on the US OTC market:

Italy-based Leonardo Finmeccanica SpA trades on the Milan Exchange under the ticker LDO.

Download: The Complete List of SIPRI Top 100 Companies from 2002-2015 (in Excel format)

Disclosure: No Positions