The Periodic Table of Commodity Returns 2007 Thru 2016

Investing in commodities is not suitable for most retail investors despite pushing them as an asset class to own. Just like stocks and bonds, hundreds of ETFs, mutual funds and other instruments exist to invest in them. Commodity investing is probably the 2nd most risky proposition after currency trading/investing. This is because unlike stocks or bonds or other assets, commodities are extremely risky by nature. For example, the price of crude oil on the global markets can change based on any number of reasons. A handful of men knocking out an oil pipe in Nigeria for example, can cause the price of oil to increase. Besides investors have to understand and worry about situations like Contango. Though gold is one commodity which is preferred by many investors, it is still not suitable for all investors. Gold as asset class does not produce any consistent income such as dividends and the only way to profit from investing in them is by price appreciation. Agricultural commodities are even riskier as natural events like rain or droughts can impact prices of corn, soybean, coffee, rice, cocoa, wheat, etc.

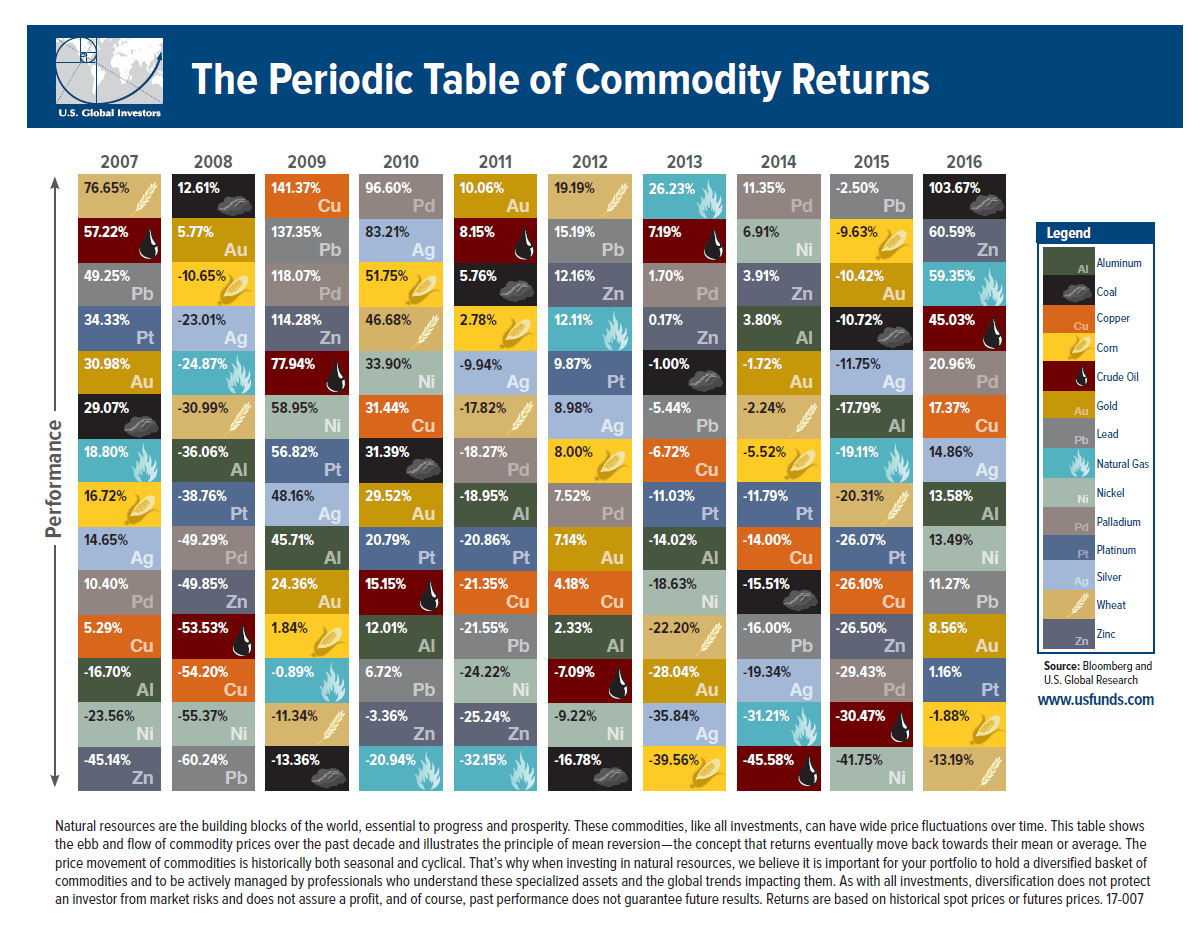
With that introduction, below is The Periodic Table of Commodity Returns for 2016:

Click to enlarge
Source: US Funds

Download: The Periodic Table of Commodity Returns 2007 Thru 2016 (in pdf format)

Last year, coal was the top performing commodity which more than doubled in price. The outcome of US elections gave a boost to coal is an understatement.After a few years of low to stagnant prices, crude oil soared in 2016 with a return of over 45%.

Related ETFs:

  • SPDR Gold Shares (GLD)
  • United States Oil Fund LP (USO)

Disclosure: No Positions

The Periodic Table of Emerging Markets 2016

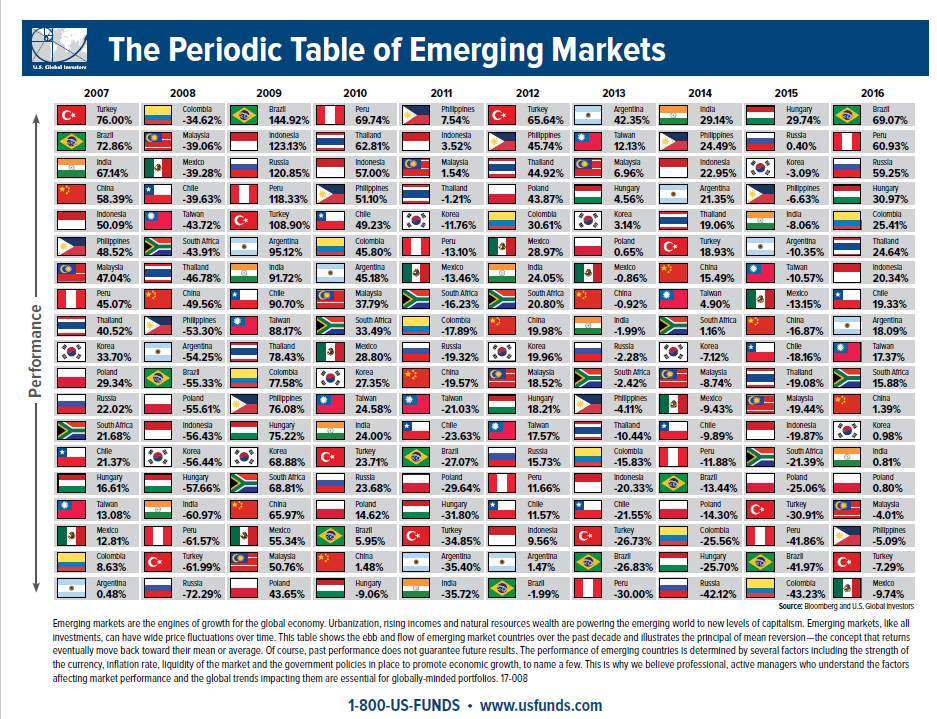
The Periodic Table of Emerging Markets for 2016 is shown in the chart below:

Click to enlarge

Source: US Funds

Brazil was the top performing market last year with a 69% return followed by Peru. Among the BRICs, China and India were basically flat. This chart also shows that no country is a top market year after year and the need for diversification among emerging markets.

Download: The Periodic Table of Emerging Markets 2016 (in pdf)

Related ETFs:

  • iShares MSCI Mexico Capped Investable Market (EWW)
  • iShares FTSE/Xinhua China 25 Index (FXI)
  • Market Vectors Russia ETF (RSX)
  • iShares S&P India Nifty 50 Index (INDY)

Related Post:

Disclosure: No positions

European Stocks Are Attractive Based on CAPE Ratio

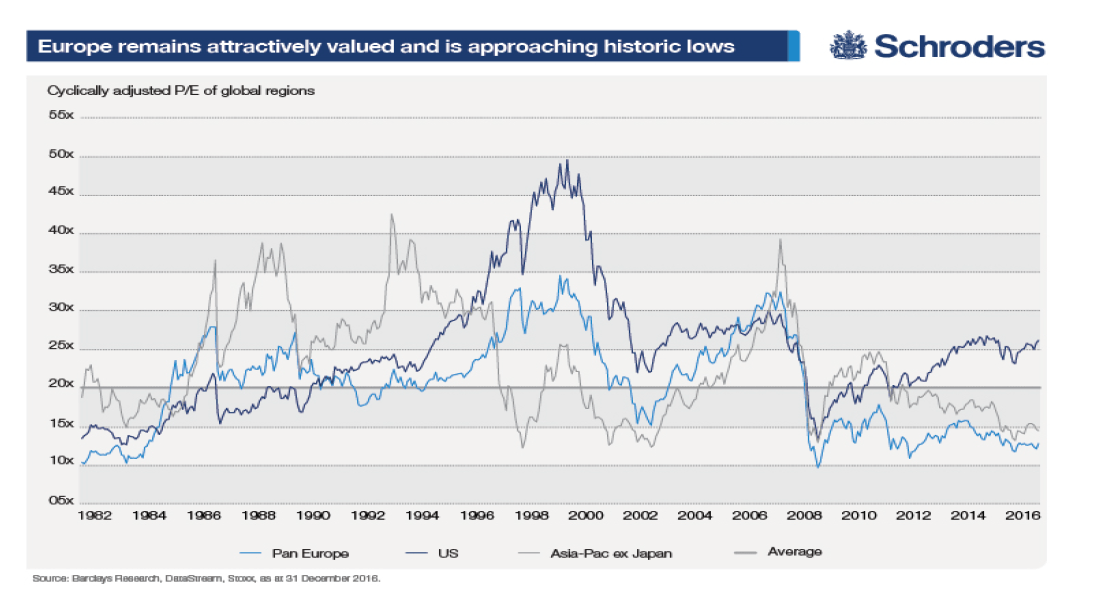
European equities are attractive now relative to Asia-Pacific excluding Japan and US equities based on cyclically-adjusted P/E ratio. As the chart below shows the ratio is at 2009 levels for European stocks.

Click to enlarge

Source: EuroView: Rotation, earnings recovery and a view from the US, Schroder’s

According to the above report by Schroder’s, in the past stocks from Europe disappointed investors even though they were attractive. However this time it could be different since many sectors are recovering from troughs. As earnings estimates improve and firms generate higher profits, re-rating of stocks could propel them to higher levels. So as markets are forward-looking and P/E ratios will expand should earnings recover, higher multiples will lead to higher stock prices.

Some of the stocks that could be re-rated and offer potential growth opportunities are: ING Groep NV (ING), Banco Santander SA (SAN), Total SA (TOT), Nestle SA (NSRGY), Henkel AG & Co KGaA (HENKY),Siemens AG (SIEGY), Unilever NV (UN). etc.

Disclosure: Long ING and SAN

All Trains Have Left The Station ?

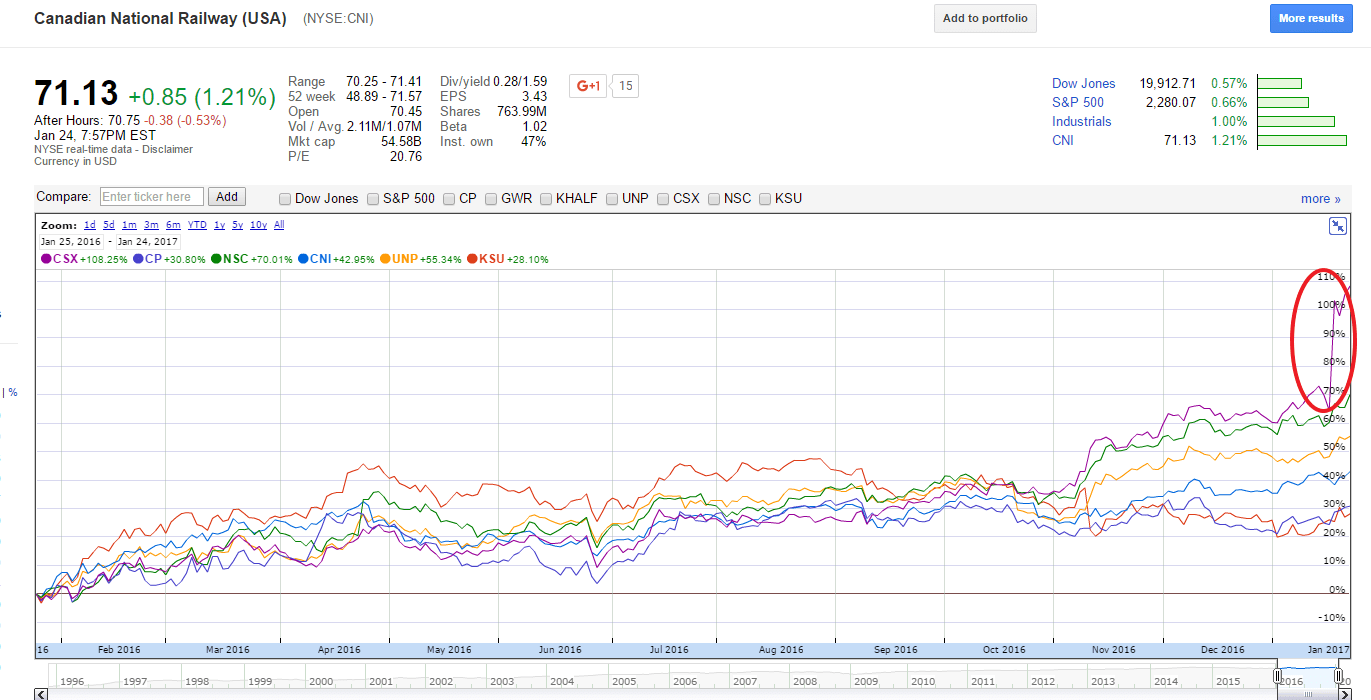
Railroad stocks are performing very well in the past few months. North American railroads were in doldrums last year for many months as it seemed like all the industries they are involved with were struggling. However those days were some of the best time to pick up the railroad stocks. As the 1-year chart below shows major railroads have soared recently especially after the US elections:

Click to enlarge

Source: Google Finance

Canadian National Railway Co (CNI) about 43% in the past year excluding dividends. Today Canadian National announced excellent 4th quarter earnings and also increased its dividend payments by a solid 10%. Similarly Norfolk Southern (NSC) rewarded shareholders with a 3 percent increase in dividends.

CSX has been the winner among the major railroads with an astonishing rise of over 108% in price alone over the past year. Recently the stock soared (as noted by the circle in the chart above) when it railroad legend Hunter Harrison quit Canadian Pacific (CP) to join forces with an activist investor and shakeup CSX like he did with CP before.

As the US economy improves and railroads announce higher profits and dividends going forward, their stocks may still have room to run. Since there are only a handful of players investor demand for stocks can propel prices even higher from current levels.

So though it may feel like all the railroad stocks have left the station a few months ago, investors willing to hold for the long-term may still considering getting on-board.

Disclosure: Long CNI, CSX, NSC, UNP

Comparing Union Membership Rates in Europe and USA

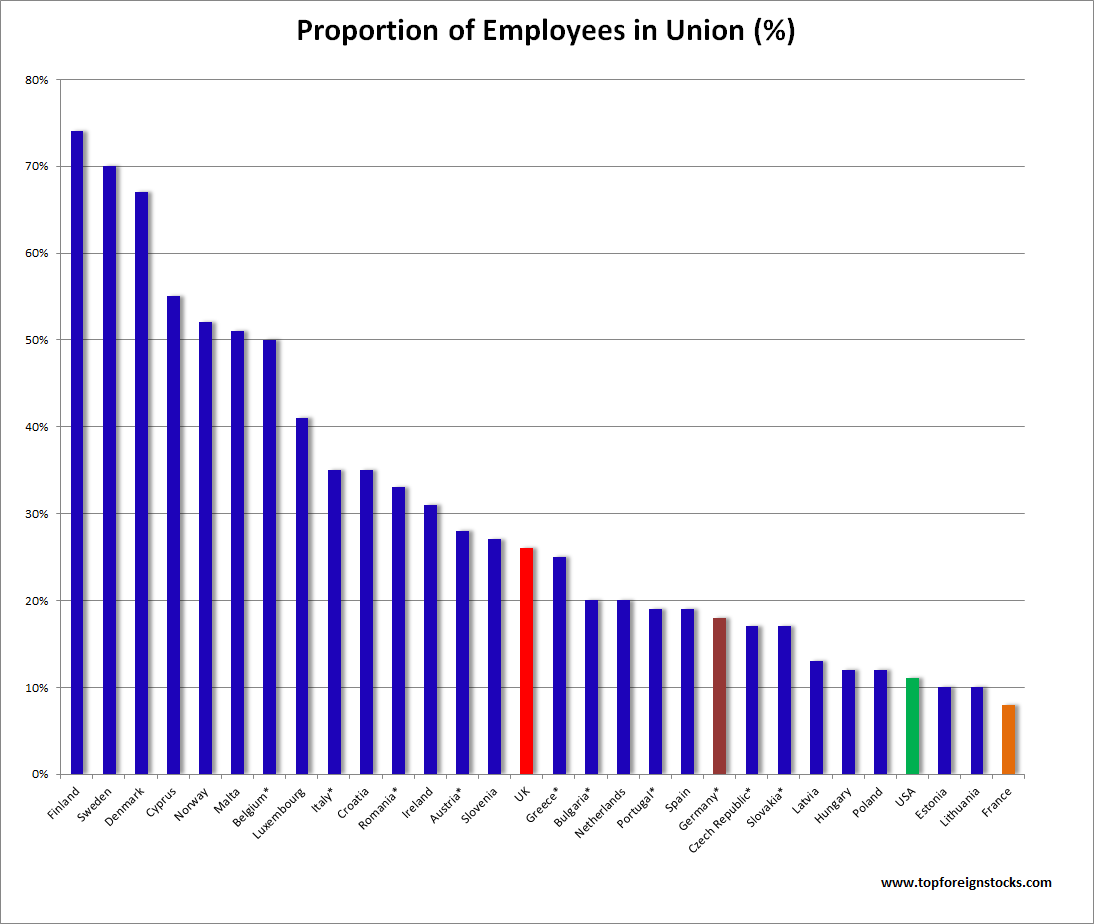
The Union Membership Rate of employees vary widely across countries in Europe and the USA. In Europe, the Scandinavian countries of Finland, Sweden and Norway have the highest union membership rates. The US has one of the lowest union membership rate when compared to most European countries.

The chart below shows the union membership rate across Europe and the US:

Click to enlarge

Data Sources: US BLS and ETUI 

Though European countries have high union membership rates, in general membership has been declining in recent years according to an article at ETUI. The membership rate is 74%  in Finland, 70% in Sweden and 67% in Denmark. It is just 8% in France. The low rate in France is surprising. But the power of union workers is strong in France as they are able to mobilize support and launch strikes and other actions at will bringing the country to a standstill.

The only three countries that have lower membership rates than the US are Estonia, Lithuania and France. As mentioned above, French unions have more power due to labor laws and support from the general population. According to the BLS,  the percentage of workers participating in unions was just 11.1% in 2015. Or to put it another way, only 14.8 million workers out of many millions belonged to a union. This is not surprising as unions have historically had bad reputation.