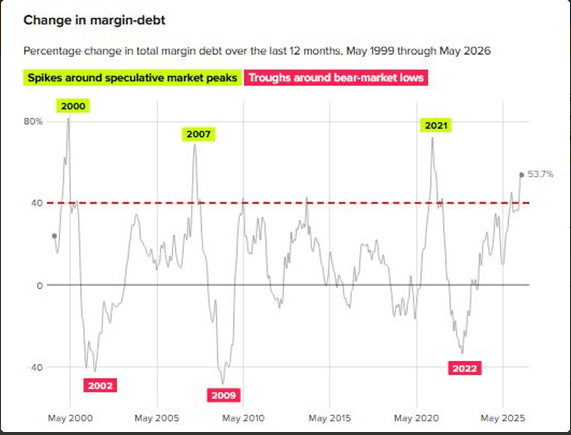
The Periodic Table of Emerging Markets for 2016 is shown in the chart below:
Click to enlarge
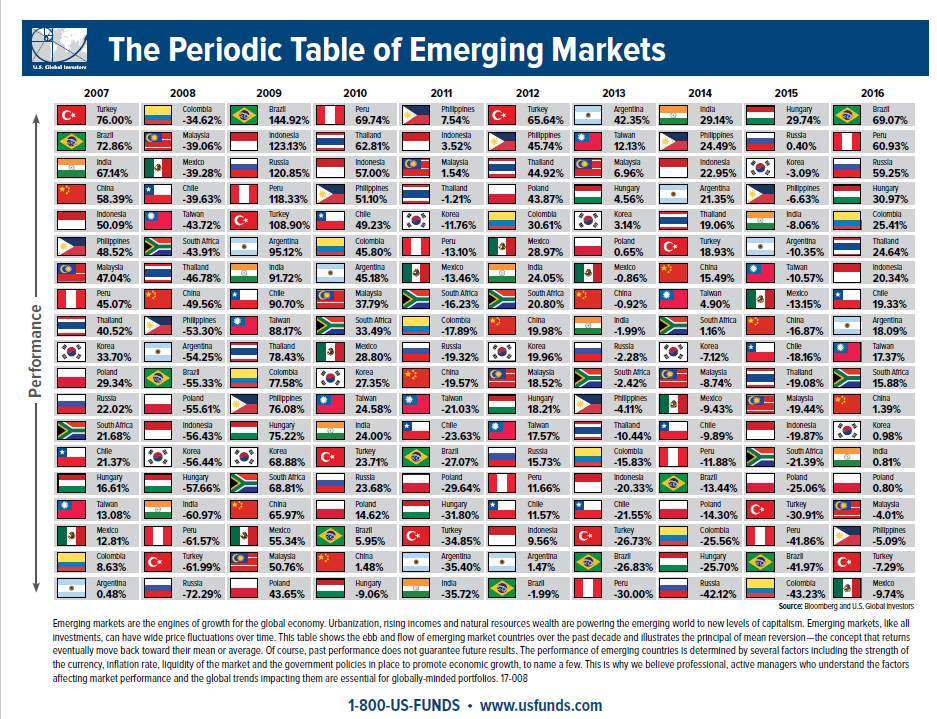
Source: US Funds
Brazil was the top performing market last year with a 69% return followed by Peru. Among the BRICs, China and India were basically flat. This chart also shows that no country is a top market year after year and the need for diversification among emerging markets.
Download: The Periodic Table of Emerging Markets 2016 (in pdf)
Related ETFs:
- iShares MSCI Mexico Capped Investable Market (EWW)
- iShares FTSE/Xinhua China 25 Index (FXI)
- Market Vectors Russia ETF (RSX)
- iShares S&P India Nifty 50 Index (INDY)
Related Post:
Disclosure: No positions