Investing in commodities is not suitable for most retail investors despite pushing them as an asset class to own. Just like stocks and bonds, hundreds of ETFs, mutual funds and other instruments exist to invest in them. Commodity investing is probably the 2nd most risky proposition after currency trading/investing. This is because unlike stocks or bonds or other assets, commodities are extremely risky by nature. For example, the price of crude oil on the global markets can change based on any number of reasons. A handful of men knocking out an oil pipe in Nigeria for example, can cause the price of oil to increase. Besides investors have to understand and worry about situations like Contango. Though gold is one commodity which is preferred by many investors, it is still not suitable for all investors. Gold as asset class does not produce any consistent income such as dividends and the only way to profit from investing in them is by price appreciation. Agricultural commodities are even riskier as natural events like rain or droughts can impact prices of corn, soybean, coffee, rice, cocoa, wheat, etc.
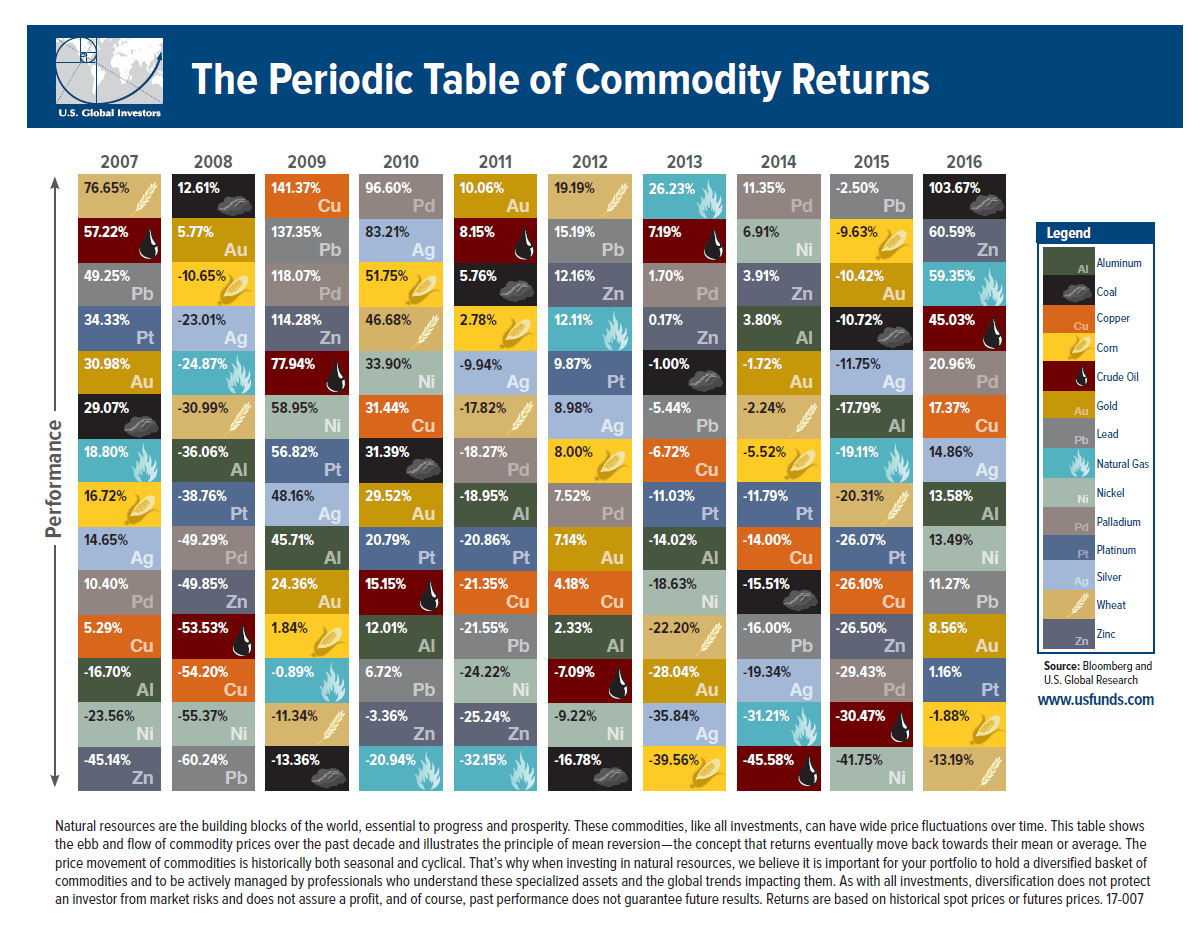
With that introduction, below is The Periodic Table of Commodity Returns for 2016:
Click to enlarge
Source: US Funds
Download: The Periodic Table of Commodity Returns 2007 Thru 2016 (in pdf format)
Last year, coal was the top performing commodity which more than doubled in price. The outcome of US elections gave a boost to coal is an understatement.After a few years of low to stagnant prices, crude oil soared in 2016 with a return of over 45%.
Related ETFs:
Disclosure: No Positions