Samsung Organizational Structure

The South Korean economy is dominated by a handful of Chaebols. One of these conglomerates is Samsung. The following chart shows the size and complexity of Samsung:

Click to enlarge


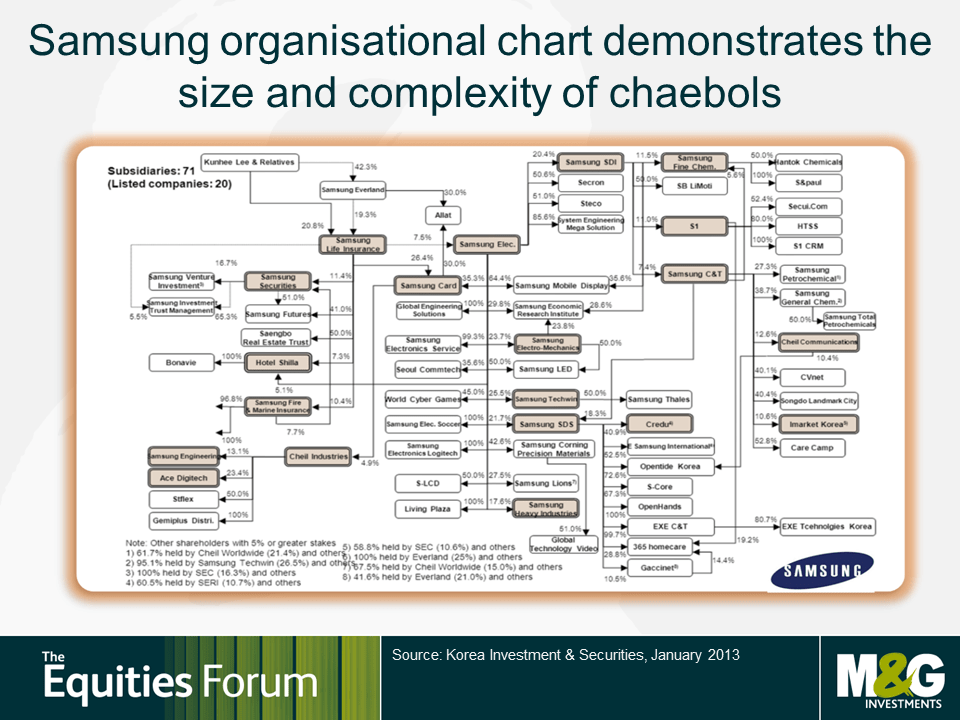
Source: Why a horse named Vitana V might be good news for Korean equities, The Equities Forum, M&G Investments

Update (Aug, 2017):

Samsung Ownership Structure-2017

Click to enlarge

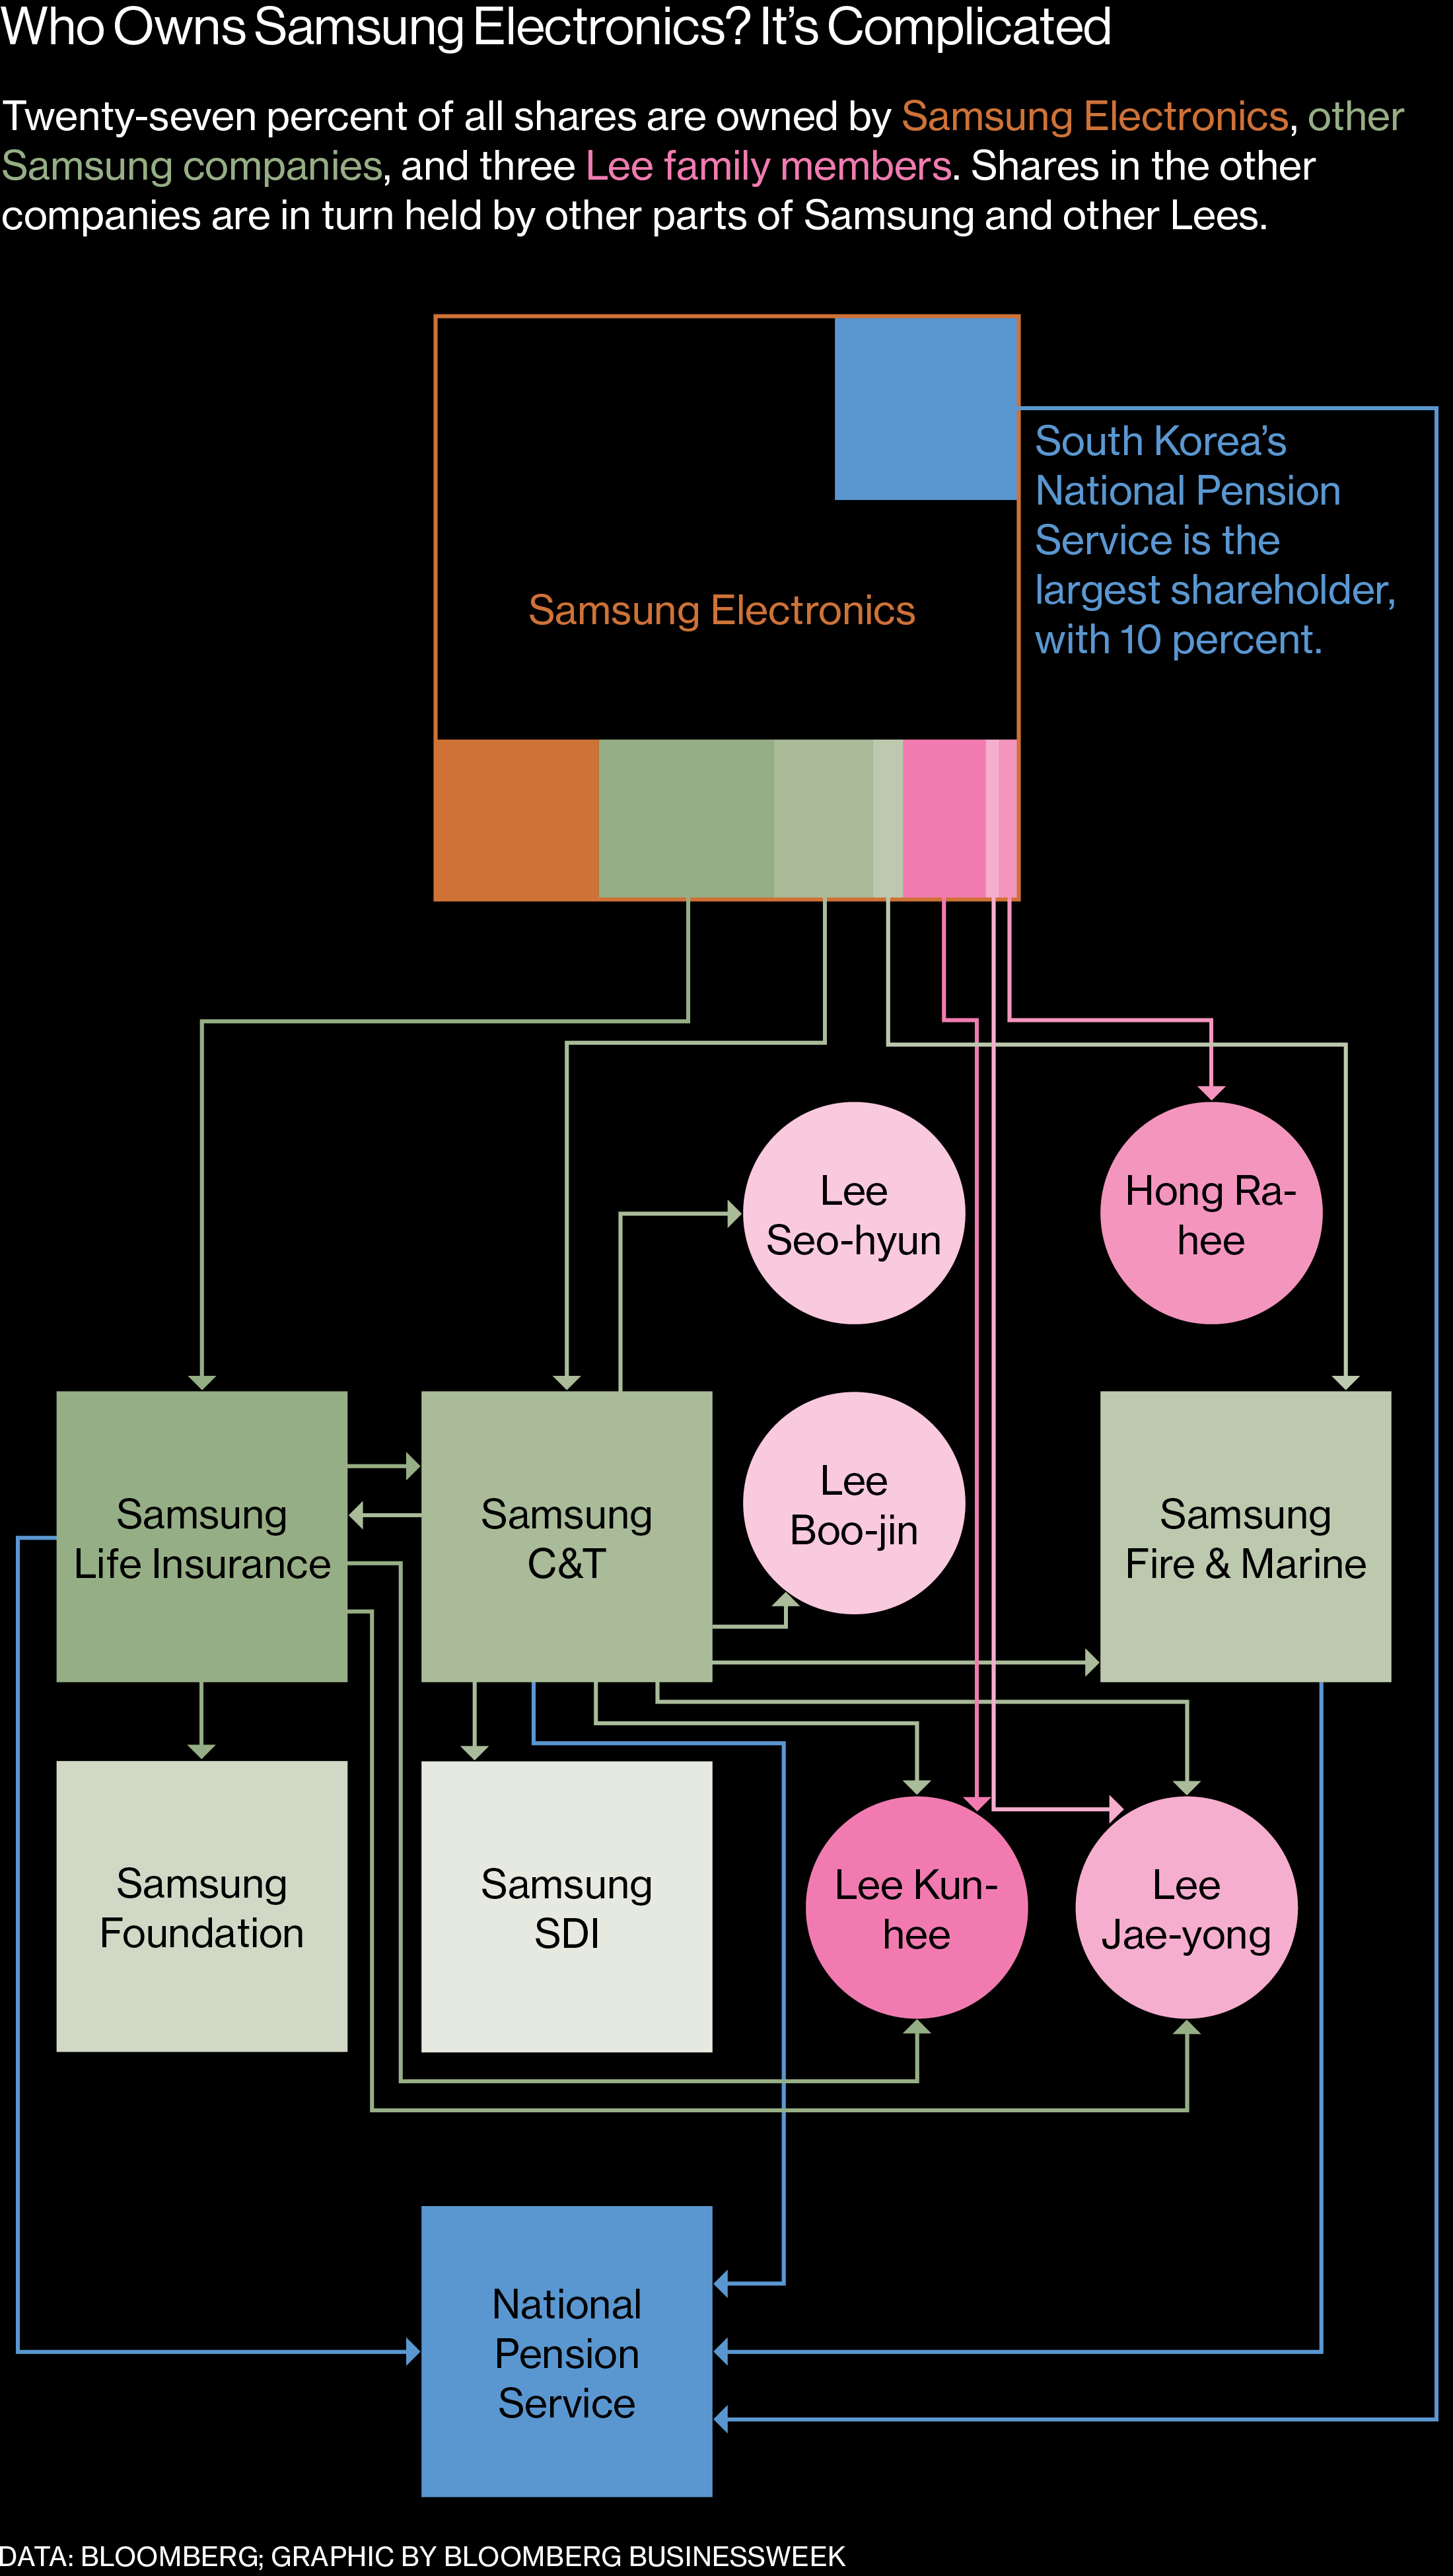
Source: Summer of Samsung: A Corruption Scandal, a Political Firestorm—and a Record Profit, Bloomberg BusinessWeek

Also see:

The Top 12 Current Account Surplus Countries

The Top 3 current account surplus in 2006 were China, Japan and Germany in that order. In 2016, Germany became the world’s top current account surplus country:

Click to enlarge

Source: Your morphing global savings glut, FT Alphaville

From an investment point of view, sometimes surplus countries are better for investment than deficit countries. The US is traditionally a current account deficit country.Last year the country was the world’s top deficit country.

Forecasting Economic Trends and Industry Trends is Futile

“Prediction is very difficult, especially about the future.” – Niels Bohr

Forecasting economic trends is difficult especially trying to predict the performance of equity markets relative to the economic trend. For example, the relationship between equity returns and economic growth for a given country is tenuous at best. To put it another way, just because a country’s economy is growing strong does not mean it will lead to higher equity returns and vice versa. It is perfectly possible for a stagnant or low growing country to produce excellent equity returns.

The following chart shows the negative correlation between GDP per capita growth and real equity returns:

Click to enlarge

Source: Beware the siren song of growth, Dan Brocklebank, Allan Gray

Analysis of data over a century and across 19 countries proved the above theory according to the author Dan.

Similarly predicting industry trends is also a fool’s game. Simply going with what is hot does necessarily produce the best returns. Dan uses the example of equity investments in IBM (IBM) and Altria(MO) back in the 70s to prove this point. From the article:

Imagine if you could go back in time to the early 1970s. Armed with perfect foresight, you would know that computers, smartphones and all sorts of technology would become ubiquitous. You would also know that smoking would eventually be banned in many public places and the tobacco industry would be subject to costly lawsuits and onerous regulation. With that in mind, would you have invested in technology or tobacco stocks?

Intuitively, it would seem to be an easy decision. But you may be surprised to learn that the largest tobacco stock at the time would have been a massively better investment than that era’s largest technology company. A US$1,000 investment in IBM on 1 January 1975 would have grown to US$48,000 at the end of 2016—not a bad result. But a similar investment in tobacco company Philip Morris—now known as Altria—would now be worth about US$1.2 million!

The main reason why foresight has proved so poor in this regard is that growing industries tend to be glamorous and attract both talent and plenty of new competition. In contrast, the low-tech and litigation-prone tobacco industry experienced a considerable decline in competition, leaving the incumbents to make substantial profits as existing competitors left the business. When did you last meet an MBA graduate who said his ambition in life was to start a new tobacco company?

The two takeaways from this post are: investors should not assume fast-growing economies will produce great equity returns and today’s hot technology or industry trend may may not be the best place to park your money for long-term superior returns.

Disclosure: No Positions


Comparing the Performance of Australian vs. Global Stocks

Australian stocks have rebounded sharply in the past few months as commodity markets have recovered. In terms of equity market performance since the Global Financial Crisis of 2008-09 thru last year, Australian stocks have under-performed the US market as measured by the S&P 500 index as shown in the chart below:

Click to enlarge


However Australian stocks have high dividend yields compared to the US market. While the S&P 500’s dividend yield has remained around 2% for many years now, the yield on the ASX 200 is over 4%. The dividend payout ratio is also very high in Australia. The ratio was over 90% in 2016 compared to just around 50% in the US. So when dividends are included Australian stocks’ performance improves relative to US stocks:

Source: Australian vs US Stock Market, Rivkin

The chart below shows Australian dividend payout ratio since 1960:

Click to enlarge

Similar to a few other markets, Australian stocks have surpassed their pre-financial crisis peak when dividends are included:

While in the short-term Aussie stocks have under-performed (excluding dividends), in the very long-term they have outperformed most markets including the US.

Source: Why have Australian shares underperformed global shares? Will it continue?, AMP Capital

US investors looking to invest in Australia have a few companies listed on the US exchanges. But the majority of Aussie stocks trade on the OTC markets including the major banks. Investors can check out the full list of Australian ADRs page for more details.

West Virginia Coal Employee-Production Gap: Chart

The number of American workers employed in the coal industry is at a near-record low.According to EIA, the total number of coal workers stood at 65,971 in 2015. This is the lowest figure since the agency started gathering data in 1978.

One of the major coal mining states in the US is West Virginia. Coal mining jobs in the state has been on the decline since the late 70s as shown in the chart below from US Funds:

Click to enlarge

Source: Can Trump Dig Coal out of Its Slump?, US Funds

From the article:

Take a look at the 114-year history of the coal industry in West Virginia, the second-largest U.S. coal producer after Wyoming. Since shortly after World War II, the number of coal mining jobs has steadily decreased. In 2014, the state industry employed a little over 18,000 people, a far cry from the 125,000 it employed in 1948.

A recent FT Alphaville article discussed why Appalachian coal is unlikely to experience a recovery anytime.From the piece:

Here is one thing that is not true: Easing those rules, as President Trump’s executive order encourages, will lead to a coal-based Appalachian Renaissance. For one, some of the most strenuous regulations slated for review haven’t even been implemented, as they were still held up by court challenges at the time of Trump’s executive order.

But broadly, the biggest problem with expecting a coal revival in Appalachia is basic geology, not greenhouse-gas emissions. West Virginia’s coal boom started in the late 1800s, according to the state’s Department of Culture — yes, it exists, don’t get cute — and as extraction continued over the following century, miners had to go deeper and deeper into the earth to reach it.

So the productivity of mines in the Appalachian region is lower than that of mines in Illinois, and well below mines in Wyoming and Montana (the “west region” in the chart below):

That helps explain why mining provided such a large share of the jobs in West Virginia, since low-productivity mines require more hours of work. But it’s tougher to justify investment in those type of mines after an industry-wide debt reorganisation, with at least six bankruptcies of publicly traded coal companies in one year.

What’s more, regulations on US power-plant emissions don’t really affect the market for Appalachia’s hot-burning metallurgical coal, known as met coal, which is used in industrial processes such steelmaking.

“With met coal, you’re looking at completely different drivers” for the market, like “what does China do?” said Zachary Bader, senior distressed debt analyst with Reorg Research.

Source: Coal isn’t dead, but it won’t revive Appalachia, either, FT Alphaville